
quiver — Visualize 2-D vector fields with quiver plots in MATLAB and RunMat.
quiver visualizes 2-D vector fields as arrows anchored at data points. Supported call forms, scaling behavior, and returned handle semantics follow MATLAB behavior.
Syntax
h = quiver(U, V)
h = quiver(X, Y, U, V)
h = quiver(X, Y, U, V, LineSpec)
h = quiver(X, Y, U, V, Name, Value, ...)
h = quiver(ax, U, V)
h = quiver(ax, X, Y, U, V)
h = quiver(ax, X, Y, U, V, LineSpec)
h = quiver(ax, X, Y, U, V, Name, Value, ...)
Inputs
| Name | Type | Required | Default | Description |
|---|---|---|---|---|
U | NumericArray | Yes | — | Vector field x-components. |
V | NumericArray | Yes | — | Vector field y-components. |
X | NumericArray | Yes | — | X coordinates (vector or matrix). |
Y | NumericArray | Yes | — | Y coordinates (vector or matrix). |
lineSpec | StyleSpec | Yes | — | Line style/color shorthand. |
props | Any | Variadic | — | Name/value quiver style properties. |
ax | AxesHandle | Yes | — | Target axes handle. |
Returns
| Name | Type | Description |
|---|---|---|
h | NumericScalar | Handle to the rendered quiver plot. |
Errors
| Identifier | When | Message |
|---|---|---|
RunMat:quiver:InvalidArgument | Input data, axes targeting, or quiver style arguments are invalid. | quiver: invalid argument |
RunMat:quiver:Internal | Internal quiver construction or rendering fails unexpectedly. | quiver: internal operation failed |
How quiver works
quiver(U, V)builds the default coordinate grid from the shape ofUandV.quiver(X, Y, U, V)accepts explicit coordinate vectors or meshgrid-style axes, depending on the input layout.- The returned value is a quiver-handle object that can be queried and updated through
getandset. - Auto-scale factor, head size, line width, color, and display-name workflows are all part of the plotting property path.
- Dedicated GPU geometry generation keeps vector-field rendering on device when plotting-compatible U/V buffers are available, including
quiver(U,V)with an implicit coordinate grid. - Integer X, Y, U, and V inputs retain their exact class, shape, and values in graphics properties and serialized scenes, including 64-bit values beyond binary64's exact range; only the renderer cache crosses the floating geometry boundary.
Options
'AutoScaleFactor'/'Scale'controls arrow scaling.'MaxHeadSize'/'HeadSize'controls the size of arrowheads.- Line-style color and width workflows are supported through the same style parsing and handle/property path used by other line-like plots.
Does RunMat run quiver on the GPU?
The direct quiver path emits renderer-ready arrow geometry from GPU buffers on the happy path.
Axes-local state and handle/property workflows stay aligned across GPU and fallback rendering paths.
Replay/export paths read back GPU source buffers when serializable plot data is required.
GPU memory and residency
quiver preserves GPU residency on the direct path by building arrow geometry from exported GPU U/V buffers. Explicit GPU X/Y coordinates also stay resident when their precision matches U/V. Implicit default X/Y grids are uploaded as compact meshgrid-vector axis buffers, and explicit host X/Y coordinates are uploaded as axis buffers, so resident U/V inputs do not have to be gathered. If the direct geometry path is unavailable for the active input combination, RunMat falls back while preserving the same quiver semantics and handle behavior.
Examples
Create a vector field from U and V only
[X, Y] = meshgrid(-2:0.5:2, -2:0.5:2);
U = -Y;
V = X;
quiver(U, V);
Expected output:
% RunMat infers the coordinate grid from the vector-field shapeProvide explicit coordinates for a flow field
[X, Y] = meshgrid(-2:0.5:2, -2:0.5:2);
U = -Y;
V = X;
quiver(X, Y, U, V);
Adjust arrow scaling and head size through the handle
[X, Y] = meshgrid(-2:0.5:2, -2:0.5:2);
U = -Y;
V = X;
h = quiver(X, Y, U, V);
set(h, 'AutoScaleFactor', 1.5, 'MaxHeadSize', 0.2, 'DisplayName', 'rotation');
legend;
Gradient vector field over a scalar potential
[X, Y] = meshgrid(linspace(-2, 2, 25), linspace(-2, 2, 25));
Z = X .* exp(-X.^2 - Y.^2);
[DX, DY] = gradient(Z, X(1,2)-X(1,1), Y(2,1)-Y(1,1));

contourf(X, Y, Z, 15);
hold on;
quiver(X, Y, DX, DY, 'k', 'LineWidth', 1);
hold off;

colormap('turbo');
colorbar;
title('Gradient Field over Scalar Potential');
xlabel('x');
ylabel('y');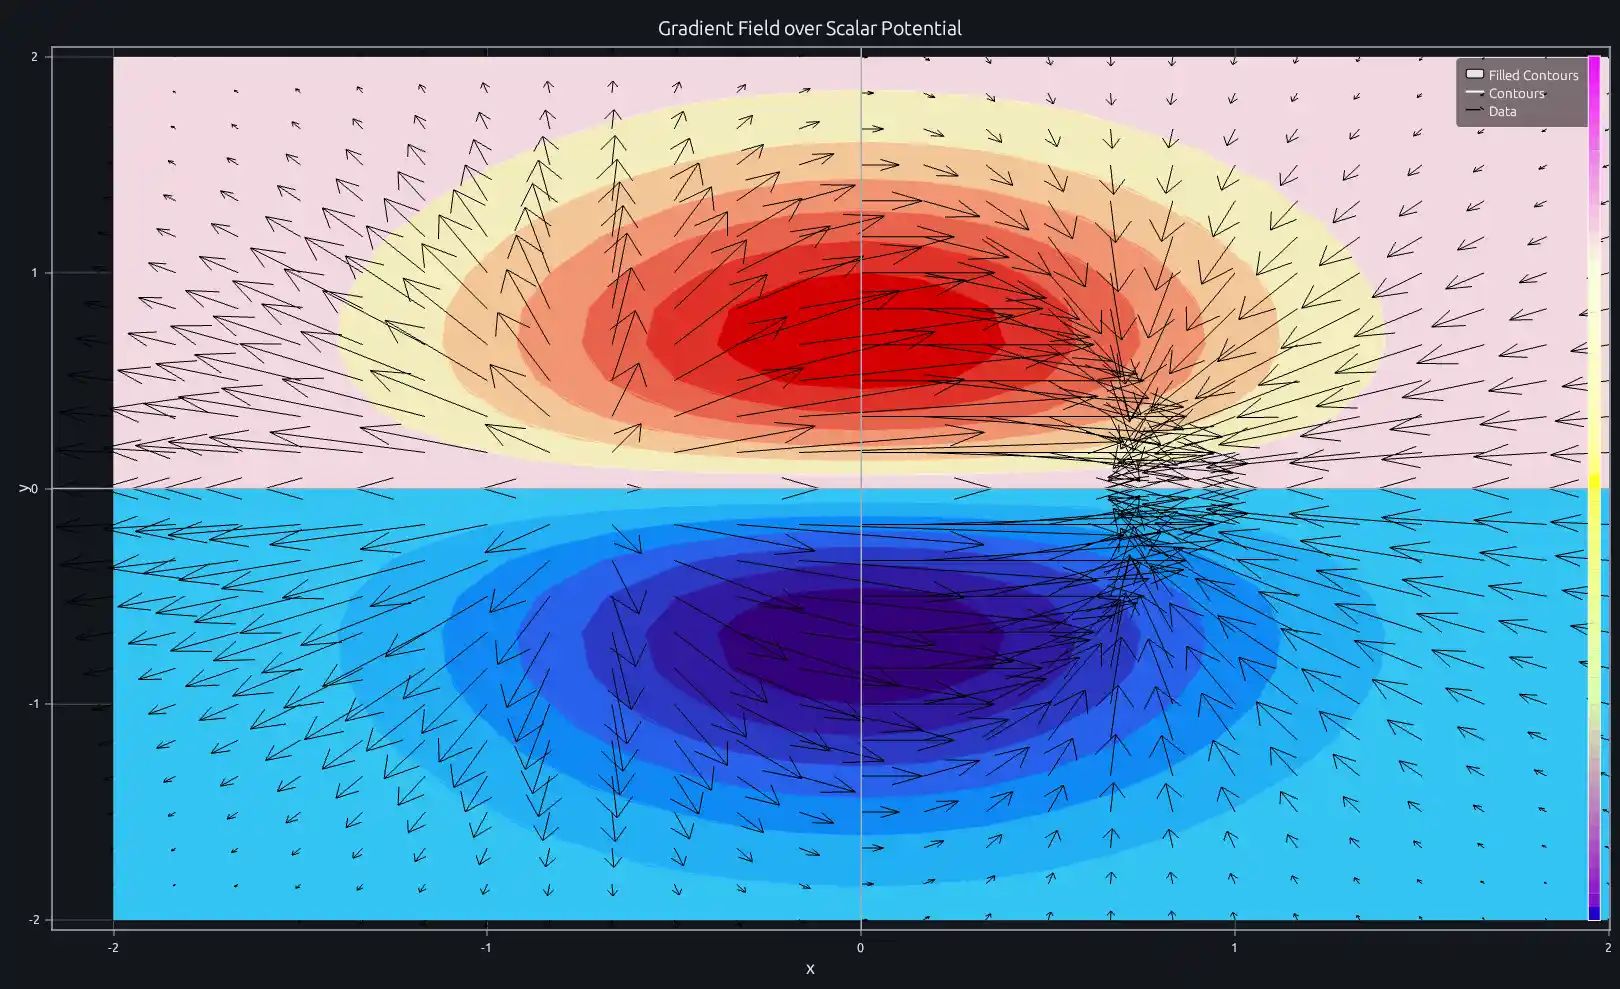
Compare this result with other chart types in the MATLAB Plot Gallery.
Using quiver with coding agents
Open a RunMat example with live inputs, then ask the agent to explain how quiver changes the result.
Run a small quiver example, explain the result, then change one input and compare the output.
FAQ
How do I control arrow lengths in a quiver plot?⌄
Use the 'AutoScaleFactor' property. A value of 1 means default scaling, 0 disables auto-scaling entirely (arrows drawn at raw data magnitude), and values like 1.5 or 2 make arrows proportionally longer.
h = quiver(X, Y, U, V);
set(h, 'AutoScaleFactor', 0); % raw magnitudes, no auto-scaling
Can I overlay quiver arrows on top of a contourf plot?⌄
Yes. Plot the filled contour first, then call hold on and add the quiver layer. Both share the same axes, so the coordinate grids align automatically.
contourf(X, Y, Z);
hold on;
quiver(X, Y, U, V, 'Color', 'k');
Does RunMat support 3-D quiver plots?⌄
Yes. Use quiver3 for 3-D vector fields.
quiver3(X, Y, Z, U, V, W);Related Plotting functions
2D Charts
area · bar · errorbar · heatmap · hist · histogram · loglog · pie · plot · scatter · semilogx · semilogy · stairs · stem
Other
addpoints · ancestor · animatedline · axes · barh · caxis · cla · clf · clim · colorcube · colororder · copyobj · daspect · datacursormode · dataTipTextRow · fcontour · figure · fill · fill3 · findobj · fsurf · gobjects · groot · hgload · hgsave · hidden · histogram2 · hold · line · linkaxes · openfig · opengl · pan · parula · patch · plotmatrix · plotyy · polarhistogram · polarplot · polarscatter · print · quiver3 · ribbon · saveas · savefig · sphere · stackedplot · subtitle · suptitle · text · textscatter · textscatter3 · triplot · waitbar · wordcloud · xlabel · xlim · xline · xscale · xtickangle · xtickformat · xticklabels · xticks · ylabel · ylim · yline · yscale · ytickangle · ytickformat · yticklabels · yticks · zlim · zoom
More plotting resources
Open-source implementation
Unlike proprietary runtimes, every RunMat function is open-source. Read exactly how quiver is executed, line by line, in Rust.
- View the source for quiver in Rust on GitHub
- Learn how the RunMat runtime works
- Found a bug? Open an issue with a minimal reproduction.
About RunMat
RunMat is an open-source runtime that executes MATLAB-syntax code blazing on any GPU. It is licensed under the Apache 2.0 license.
- RunMat automatically optimizes your math for GPU execution on Apple, Nvidia, and AMD hardware. No code changes needed. Simulations that took hours now take minutes.
- Start running code in seconds. RunMat runs in the browser, on the desktop, or from the CLI. No license server, no IT ticket.