
area — Create filled area plots in MATLAB and RunMat.
area creates filled area plots from vector or matrix-style inputs. It returns one area handle per plotted series, supports baseline and stacked behaviors, and participates in the shared MATLAB/RunMat plotting handle-property system.
Syntax
h = area(Y)
h = area(Y, LineSpec)
h = area(Y, basevalue)
h = area(Y, Name, Value, ...)
h = area(X, Y)
h = area(X, Y, LineSpec)
All supported area forms
h = area(Y)
h = area(Y, LineSpec)
h = area(Y, basevalue)
h = area(Y, Name, Value, ...)
h = area(X, Y)
h = area(X, Y, LineSpec)
h = area(X, Y, basevalue)
h = area(X, Y, Name, Value, ...)
h = area(ax, Y)
h = area(ax, Y, Name, Value, ...)
h = area(ax, Y, basevalue)
h = area(ax, X, Y)
h = area(ax, X, Y, Name, Value, ...)
h = area(ax, X, Y, basevalue)
Inputs
| Name | Type | Required | Default | Description |
|---|---|---|---|---|
Y | NumericArray | Yes | — | Y data vector or matrix. Columns are rendered as stacked series. |
lineSpec | StyleSpec | Yes | — | Line/color shorthand such as '--r'. |
basevalue | NumericScalar | Yes | — | Horizontal baseline value. |
props | Any | Variadic | — | Name/value style properties such as Color, LineWidth, and BaseValue. |
X | NumericArray | Yes | — | X coordinates matching the row count of Y. |
ax | AxesHandle | Yes | — | Target axes handle. |
Returns
| Name | Type | Description |
|---|---|---|
h | NumericArray | Area graphics handle or handle row vector, with one handle per plotted series. |
Errors
| Identifier | When | Message |
|---|---|---|
RunMat:area:InvalidArgument | Input data, style tokens, or name/value options are invalid. | area: invalid argument |
RunMat:area:Internal | Renderer/GPU conversion fails during chart construction. | area: internal operation failed |
How area works
area(y)uses implicit x-values1:n, whilearea(x, y)uses explicit x coordinates.- If explicit x-values are not increasing, each series is sorted by x before rendering; integer x-values are ordered in their native class before conversion to graphics coordinates.
- Matrix-style
yinputs create stacked area series in the MATLAB style. - Vector
yreturns one area handle, while matrixyreturns a row vector with one handle for each column; every handle works withgetandset. - Baseline and color workflows flow through the shared plotting property model.
- All eight integer classes are accepted for X, Y,
BaseValue, andLineWidth; integer plot data crosses one explicit client graphics conversion boundary. - Compatible floating stacked-series geometry can be emitted directly from GPU buffers on the RunMat acceleration path.
Options
- A positional numeric scalar or
'BaseValue'name-value pair sets the baseline used by area filling. 'LineWidth'accepts a positive numeric scalar, including every integer class.- Color and display-name workflows are available through the returned handle and the shared plotting property path.
Does RunMat run area on the GPU?
The direct RunMat area path emits filled geometry from compatible floating GPU data when X is implicit or a known nondecreasing host vector.
Resident integer data and explicit resident X gather on the client so exact integer ordering and documented sorting occur before conversion.
Baseline semantics, stacked-series behavior, and one-handle-per-series output remain aligned across direct and fallback paths.
GPU memory and residency
The documented GPU-array surface executes on the client, so resident integer X and Y gather with typed storage intact and convert only at the graphics boundary. RunMat preserves floating-point residency on a compatible direct path, including stacked-series geometry generation; other inputs use the semantics-preserving fallback.
Examples
Create a basic filled area plot
x = 0:0.1:1;
area(x, x.^2);
Create stacked area series from a matrix
x = 1:5;
Y = [1 2 1; 2 1 2; 3 2 1; 2 3 2; 1 2 3];
area(x, Y);
Change the baseline and label the series through the handle
x = 0:0.2:2;
h = area(x, sin(x) + 2);
set(h, 'BaseValue', 1, 'DisplayName', 'offset area');
legend;
Stacked energy mix
years = 2018:2025;
solar   = [5  8  12 18 25 33 42 50];
wind    = [10 14 18 22 28 32 36 40];
hydro   = [30 30 29 28 27 27 26 26];
mix = [solar; wind; hydro]';

area(years, mix);
title('Energy Generation Mix');
xlabel('Year');
ylabel('TWh');
legend('Solar', 'Wind', 'Hydro');
grid on;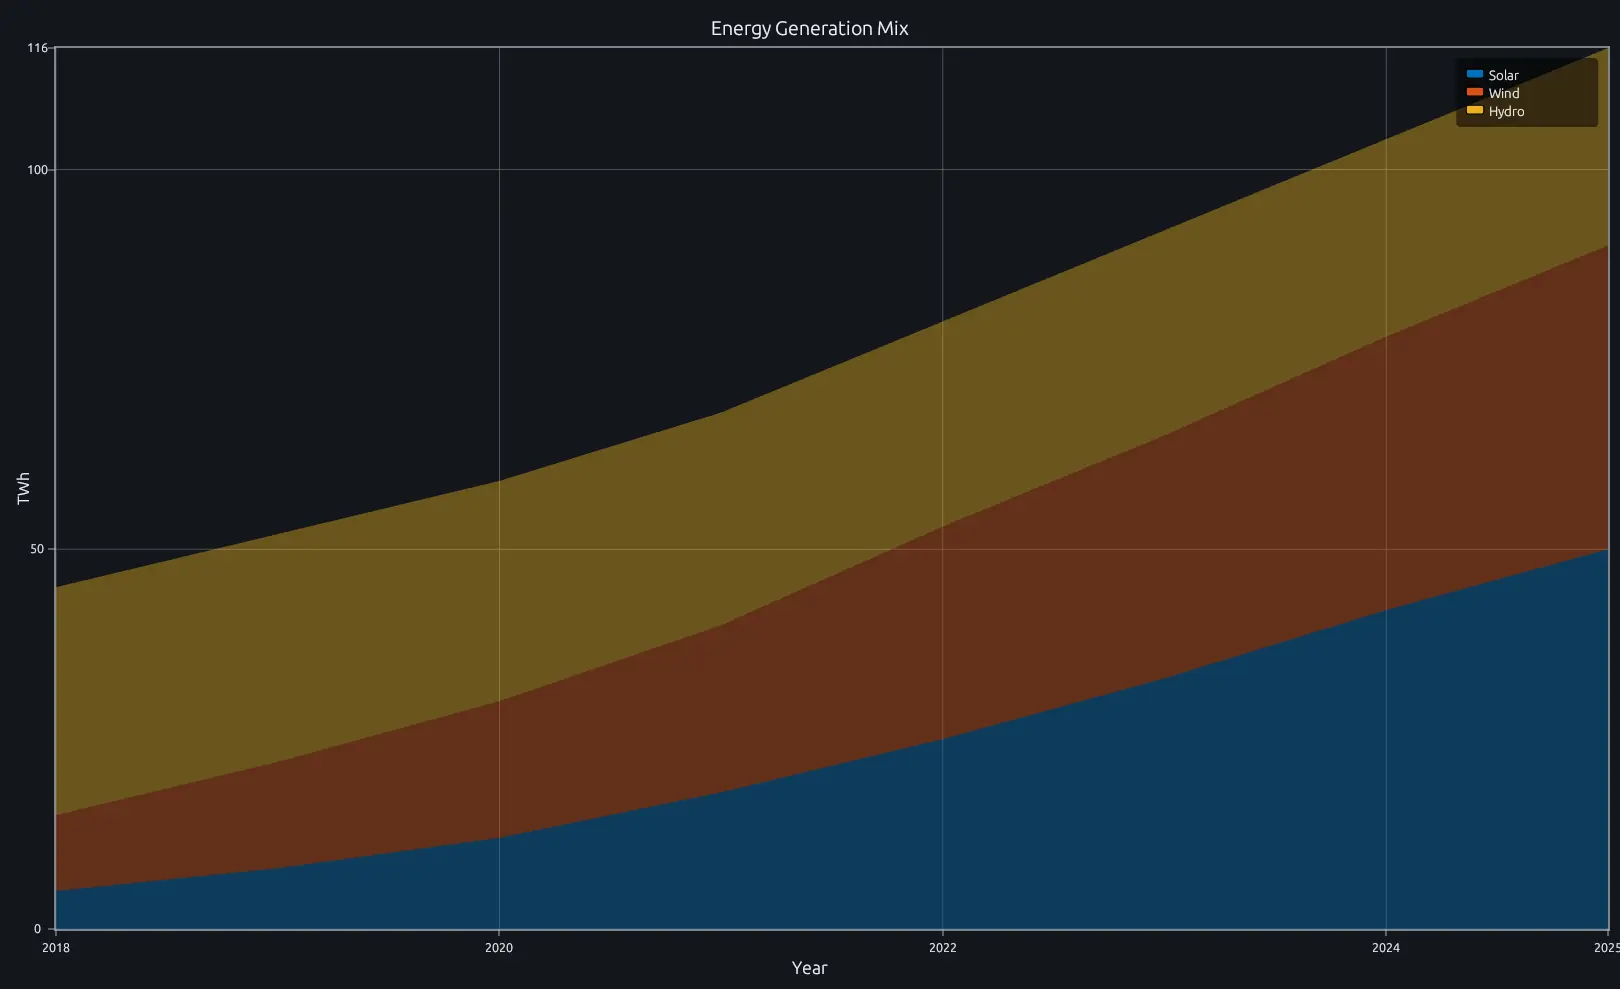
Compare this result with other chart types in the MATLAB Plot Gallery.
Using area with coding agents
Open a RunMat example with live inputs, then ask the agent to explain how area changes the result.
Run a small area example, explain the result, then change one input and compare the output.
FAQ
How do I create a stacked area chart?⌄
Pass a matrix as the y-data. Each column becomes a stacked series, and RunMat accumulates them vertically so the total is visible at the top.
x = 1:6;
Y = [2 3 1; 1 2 2; 3 1 2; 2 2 3; 1 3 1; 2 1 3];
area(x, Y);
legend('A', 'B', 'C');
How do I control the transparency of an area plot?⌄
Set 'FaceAlpha' on the area handle to a value between 0 (fully transparent) and 1 (fully opaque). This is useful when overlaying multiple area series without stacking.
area(x, y1);
hold on;
h = area(x, y2);
set(h, 'FaceAlpha', 0.4);
What's the difference between area and plot?⌄
area fills the region between the data line and the baseline, giving a visual sense of cumulative magnitude. plot just draws the line. Use area when the filled region conveys meaning—cumulative totals, part-to-whole breakdowns, or emphasizing the magnitude of a signal relative to a baseline.
Related Plotting functions
2D Charts
bar · errorbar · heatmap · hist · histogram · loglog · pie · plot · scatter · semilogx · semilogy · stairs · stem
Other
addpoints · ancestor · animatedline · axes · barh · caxis · cla · clf · clim · colorcube · colororder · copyobj · daspect · datacursormode · dataTipTextRow · fcontour · figure · fill · fill3 · findobj · fsurf · gobjects · groot · hgload · hgsave · hidden · histogram2 · hold · line · linkaxes · openfig · opengl · pan · parula · patch · plotmatrix · plotyy · polarhistogram · polarplot · polarscatter · print · quiver3 · ribbon · saveas · savefig · sphere · stackedplot · subtitle · suptitle · text · textscatter · textscatter3 · triplot · waitbar · wordcloud · xlabel · xlim · xline · xscale · xtickangle · xtickformat · xticklabels · xticks · ylabel · ylim · yline · yscale · ytickangle · ytickformat · yticklabels · yticks · zlim · zoom
More plotting resources
Open-source implementation
Unlike proprietary runtimes, every RunMat function is open-source. Read exactly how area is executed, line by line, in Rust.
- View the source for area in Rust on GitHub
- Learn how the RunMat runtime works
- Found a bug? Open an issue with a minimal reproduction.
About RunMat
RunMat is an open-source runtime that executes MATLAB-syntax code blazing on any GPU. It is licensed under the Apache 2.0 license.
- RunMat automatically optimizes your math for GPU execution on Apple, Nvidia, and AMD hardware. No code changes needed. Simulations that took hours now take minutes.
- Start running code in seconds. RunMat runs in the browser, on the desktop, or from the CLI. No license server, no IT ticket.