
MATLAB signal processing

Make MATLAB signal analysis feel live again

RunMat is a MATLAB-syntax runtime for engineering analysis. Run filters, FFTs, PSDs, and spectrograms using existing .m scripts and recorded data. Runs in the web browser, Desktop, and CLI.

View other download options.
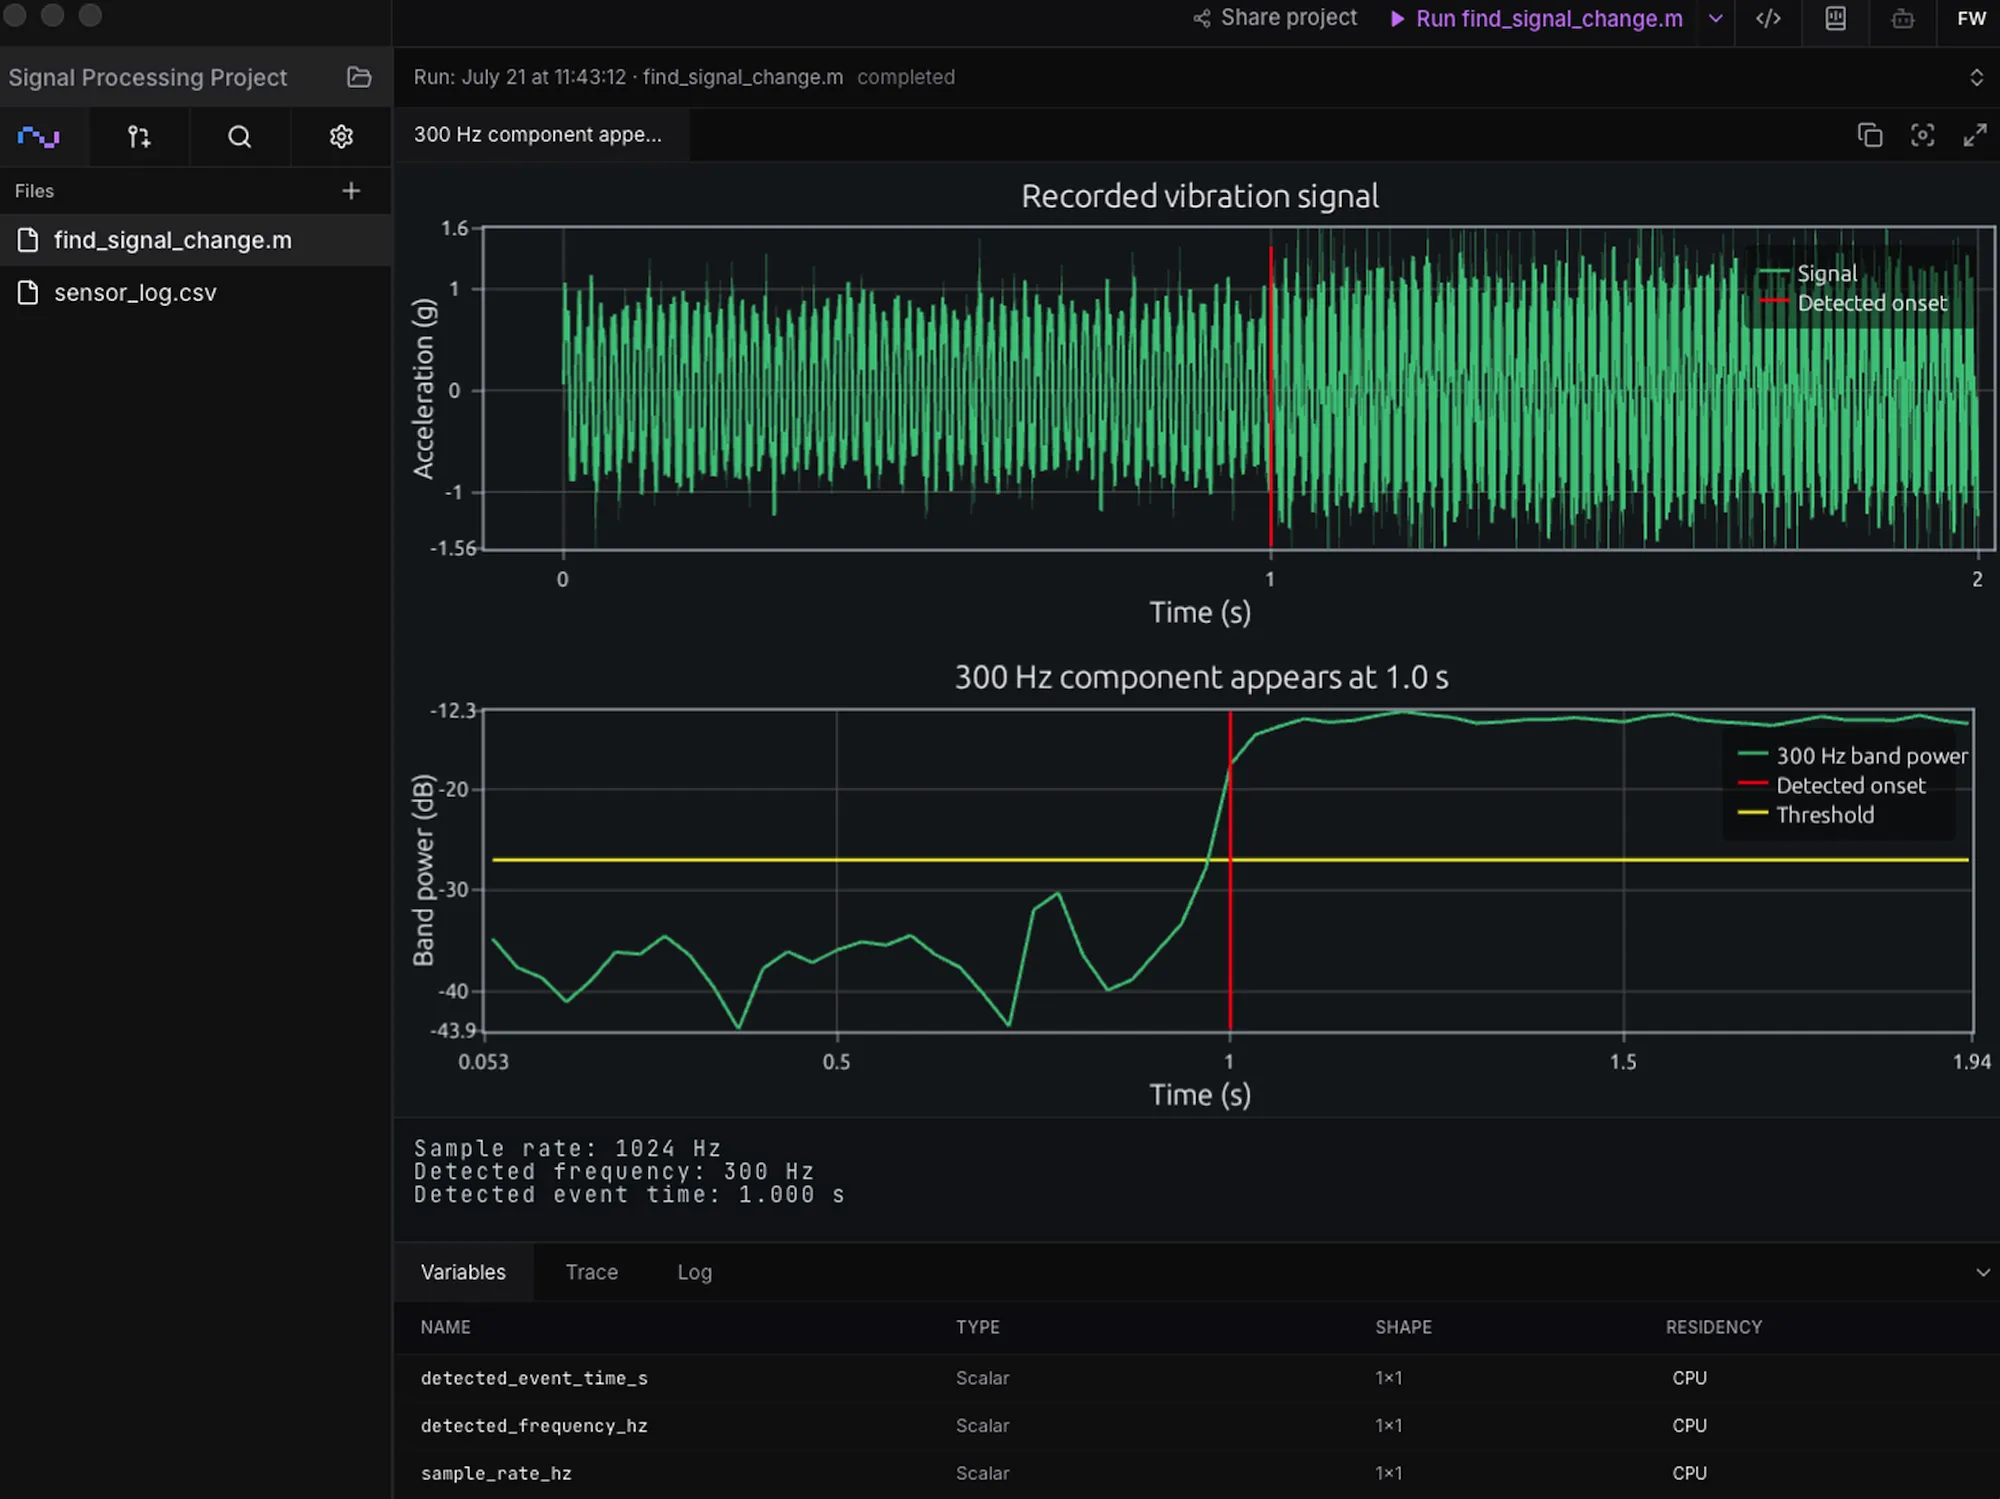
RunMat Desktop showing a recorded vibration signal, a detected 300 Hz onset, and the resulting workspace variables

Live results, not screenshots

Keep the evidence behind every signal processing task

An analysis result is only useful if another engineer can see how it was produced. RunMat lets you keep script, measurement data, plot, variables, diagnostics, and run history together while you slice and dice your signal.

Expansive set of Built-ins for signal processing workflows

RunMat includes Built-ins for file import, transforms, filters, spectral estimates, plots, saving outputs, and more.

Import files and recorded data

Read measurement exports, saved state, structured text, binary samples, and WAV/RF64 audio before plotting or filtering.

FFT, spectra, and time-frequency views

Compute spectra, shift frequency bins, estimate PSDs, render spectrograms, and inspect analytic-signal outputs.

Windows, pulses, and generated signals

Generate windows, pulses, modulation examples, and sample-rate variants for repeatable signal experiments.

Filters and convolution

Design filters, apply causal or zero-phase filtering, inspect frequency response, and run vector or matrix convolution.

Plot and visualize results

Render traces, spectra, filter responses, time-frequency images, and comparison plots from the same run.

Measure, summarize, and save outputs

Compute common signal summaries, interpolate or integrate results, and write artifacts for the next run or external tool.

RunMat Desktop turns .m scripts into live projects

Work with datasets, scripts and runs collaboratively in multi-player, GPU-enabled workspaces. See the plots, variables, and diagnostics behind each result.

File and run version history

Track edits and run outputs, compare earlier states, and restore a previous calculation.

Explore versioning
RunMat version history showing file changes and a project snapshot

Run local data on your own hardware

Open scripts and data from disk, then run them with the CPU and available GPU on your machine.

Try RunMat in your browser

Open a runnable workspace with the script, sample data, plot, and variables already wired up. Use these examples to get a feel for RunMat.

Prepare a recorded CSV for FFT

Import timestamped measurements, check for gaps and missing values, then interpolate the valid data onto a uniform sample grid.

Inspect the detected sample rate, data-quality counts, prepared signal, and correctly scaled single-sided spectrum before using your own export.

data = readmatrix('sensor_log.csv', 'NumHeaderLines', 1);
t_recorded = data(:, 1);
x_recorded = data(:, 2);
nominal_dt = median(diff(t_recorded));
valid_samples = ~isnan(x_recorded);
sample_count = round((t_recorded(end) - t_recorded(1)) / nominal_dt) + 1;
t = linspace(t_recorded(1), t_recorded(end), sample_count)';
x = interp1(t_recorded(valid_samples), x_recorded(valid_samples), t);
N = length(x); Y = fft(x - mean(x));
single_sided_amplitude = abs(Y(1:N/2+1)) / N;
single_sided_amplitude(2:end-1) = 2 * single_sided_amplitude(2:end-1);

For the deeper FFT tutorial, read the MATLAB FFT guide.

Butterworth filter tuning

Design a low-pass Butterworth filter, apply it to a noisy two-tone signal, and inspect both the filtered trace and the filter response.

Use it to check coefficient generation, filter application, response plotting, and workspace variables.

[b, a] = butter(4, 80/(Fs/2), 'low');
y = filter(b, a, x);
[H, f] = freqz(b, a, 512, Fs);
plot(t, x); hold on;
plot(t, y);
plot(f, abs(H));
Welch PSD comparison

Compare a single-run FFT magnitude with a Welch power spectral density estimate on the same noisy signal.

See how averaged spectral estimation changes the peak and noise-floor view.

N = length(x);
Y = fft(x - sum(x) / length(x));
fFft = Fs*(0:N/2)/N;
pFft = abs(Y(1:N/2+1)) * 2/N;
[pxx, fWelch] = pwelch(x, hamming(256), 128, 512, Fs);
subplot(2, 1, 1);
plot(fFft, pFft);
subplot(2, 1, 2);
plot(fWelch, pxx);
Spectrogram view

Compute a short-time Fourier transform on a signal whose frequency content changes over time.

Keep the time trace, time-frequency view, and generated workspace outputs together.

[s, f, tt, ps] = spectrogram(x, hamming(128), 96, 256, Fs);
power_db = 10 * log10(ps + 1e-12);
subplot(2, 1, 1);
plot(t, x);
subplot(2, 1, 2);
imagesc([tt(1) tt(end)], [f(1) f(end)], power_db);
axis xy;
colorbar;

Where RunMat fits today

Choose RunMat when existing .m scripts need recorded-data inspection, filter tuning, spectrum comparison, artifacts, or repeatable validation. Stay with MATLAB for Simulink, DSP deployment, or visual app workflows.

Good fit
  • Recorded-data signal workflows with MATLAB-syntax scripts.
  • FFT, windowing, filters, PSD estimates, spectrograms, convolution, and plotting workflows.
  • Desktop projects with local .m files, helper files, CSVs, saved state, packages, classes, private functions, or named entrypoints.
  • CLI validation with project entrypoints, run manifests, figure artifacts, benchmarking, and CI runs.
  • Existing .m scripts that need to stay useful while other tools consume the outputs.
Not the best fit today
  • Visual MATLAB workflows such as Simulink block diagrams, GUIDE, or App Designer apps.
  • Embedded code generation or direct production DSP deployment.
  • Broad toolbox-only pipelines outside today's core signal workflow coverage.

Signal processing FAQ

Frequently asked questions about RunMat for signal processing.

How does RunMat handle recorded signal data?⌄
Keep your .m scripts, helper files, and recorded data in the same project. Desktop and CLI read local files directly; after each run, plots, variables, diagnostics, and run history stay available so another engineer can inspect or rerun the result.
Can RunMat handle multi-file signal projects?⌄
Yes. RunMat Projects keep related .m files, helper functions, packages, classes, private functions, and local dependencies resolved together. Use runmat.toml or runmat.json when you need explicit source roots or named entrypoints; Desktop and CLI use the same project structure.
Can I repeat the same workflow from the CLI?⌄
Yes. Run the same .m file or project entrypoint from the terminal for benchmarks, CI, batch runs, or artifact generation. A signal analysis that starts in Desktop can become a repeatable headless run without changing runtimes.
Can RunMat use GPU acceleration for signal processing?⌄
Yes, for supported operations and backends. RunMat can use WebGPU in the browser and native GPU backends on Desktop. Speedups depend on array size, operation coverage, fusion, and data movement, so GPU acceleration is something to validate on the actual script.
What file-backed signal data can RunMat read today?⌄
RunMat supports readmatrix, csvread, dlmread, load, importdata, textscan, and detectImportOptions for common numeric and text imports. Outputs include writematrix, csvwrite, dlmwrite, and save. For audio, audioread supports WAV/RF64 PCM and IEEE-float samples today.
Which FFT, windowing, and spectral functions are supported?⌄
RunMat supports fft, ifft, fft2, fftshift, ifftshift, hann, hamming, blackman, periodogram, pwelch, and spectrogram. Use plotting functions like plot, subplot, imagesc, and colorbar to inspect spectra, PSD estimates, and time-frequency views.
Which filtering and convolution functions are supported?⌄
RunMat supports butter, fir1, filter, filtfilt, freqz, conv, conv2, and deconv. That covers common coefficient design, causal filtering, zero-phase filtering, FIR checks, response plots, and convolution on vector or matrix data.
Which signal-processing workflows need separate tools today?⌄
RunMat is strongest today for MATLAB-compatible scripts that import recorded data, run filters or spectral analysis, plot results, and need Desktop or CLI repeatability. Simulink block diagrams, GUIDE or App Designer apps, and certified DSP deployment remain separate workflows.
Can RunMat fit into a larger Python, C++, or CI workflow?⌄
Yes. RunMat CLI can run local .m files or project entrypoints from a larger toolchain and write outputs another tool can read. That lets MATLAB-compatible signal analysis sit beside Python, C++, Rust, or CI tooling without forcing the first validation pass to be a port.
Can RunMat's agent help with signal scripts?⌄
Yes. The agent can read project files, explain inherited .m code, run or rerun a script, inspect diagnostics, variables, and plots, then propose changes as reviewable diffs.
Can I run MATLAB signal processing code without MATLAB?⌄
Yes. RunMat runs MATLAB-compatible syntax in RunMat Desktop, the browser sandbox, and the CLI, including FFT, windowing, filtering, convolution, PSD estimates, spectrograms, plotting, and common file-backed examples. RunMat is an independent runtime, not MATLAB itself.
Is RunMat affiliated with MathWorks?⌄
No. RunMat is an independent project. MATLAB and MathWorks are trademarks of The MathWorks, Inc.; RunMat is not affiliated with or endorsed by MathWorks.

Try RunMat

Download RunMat Desktop for full performance, or run in your browser with zero setup.