
meshc — Create mesh-and-contour composite plots in MATLAB and RunMat.
meshc combines a wireframe mesh surface with contour overlays on the base plane. Composite handle and plotting behavior follow MATLAB semantics.
Syntax
h = meshc(Z)
h = meshc(X, Y, Z)
h = meshc(Z, Name, Value, ...)
h = meshc(X, Y, Z, Name, Value, ...)
Inputs
| Name | Type | Required | Default | Description |
|---|---|---|---|---|
Z | NumericArray | Yes | — | Surface height grid. |
X | NumericArray | Yes | — | X axis vector/meshgrid matrix matching Z columns. |
Y | NumericArray | Yes | — | Y axis vector/meshgrid matrix matching Z rows. |
props | Any | Variadic | — | Name/value surface style options. |
Returns
| Name | Type | Description |
|---|---|---|
h | NumericScalar | Handle to the rendered mesh surface (with contour overlay). |
Errors
| Identifier | When | Message |
|---|---|---|
RunMat:meshc:InvalidArgument | Surface/grid/axis inputs or style name/value arguments are invalid. | meshc: invalid argument |
RunMat:meshc:Internal | Internal surface/contour construction or render preparation fails unexpectedly. | meshc: internal operation failed |
How meshc works
meshcshares the same wireframe surface semantics asmeshfor the primary surface object.- The primary surface's
XData,YData, andZDataretain nativesingle,double, or integer class and exact host values, including an owner-aware snapshot of resident inputs. - The documented independent color-array and leading-axes forms are not implemented yet; this remains a general graphics-surface gap.
- The returned handle is the surface handle for the wireframe component of the composite.
- Contour overlays are produced through the shared contour path.
- View state, colormaps, and subplot-local metadata all flow through the shared axes model.
- GPU-aware execution applies where supported to both the surface and contour sides of the composite.
Examples
Create a wireframe surface with contour overlays
[X, Y] = meshgrid(linspace(-2, 2, 50), linspace(-2, 2, 50));
Z = sin(X.^2 + Y.^2);
meshc(X, Y, Z);
Compare wireframe/composite behavior with camera controls
[X, Y] = meshgrid(linspace(-3, 3, 60), linspace(-3, 3, 60));
Z = cos(X) .* sin(Y);
h = meshc(X, Y, Z);
view(3);
colormap('parula');
Inspect the returned primary surface handle
[X, Y] = meshgrid(1:20, 1:20);
Z = X - Y;
h = meshc(X, Y, Z);
get(h, 'Type')
Expected output:
ans =
    'surface'
Rendered meshc example
[X, Y] = meshgrid(linspace(-3, 3, 80), linspace(-3, 3, 80));
Z = (X.^2 - Y.^2).*exp(-0.18*(X.^2 + Y.^2));

meshc(X, Y, Z);
colormap('turbo');
colorbar;
title('Coupled Response Surface');
xlabel('x');
ylabel('y');
zlabel('Response');
view(40, 28);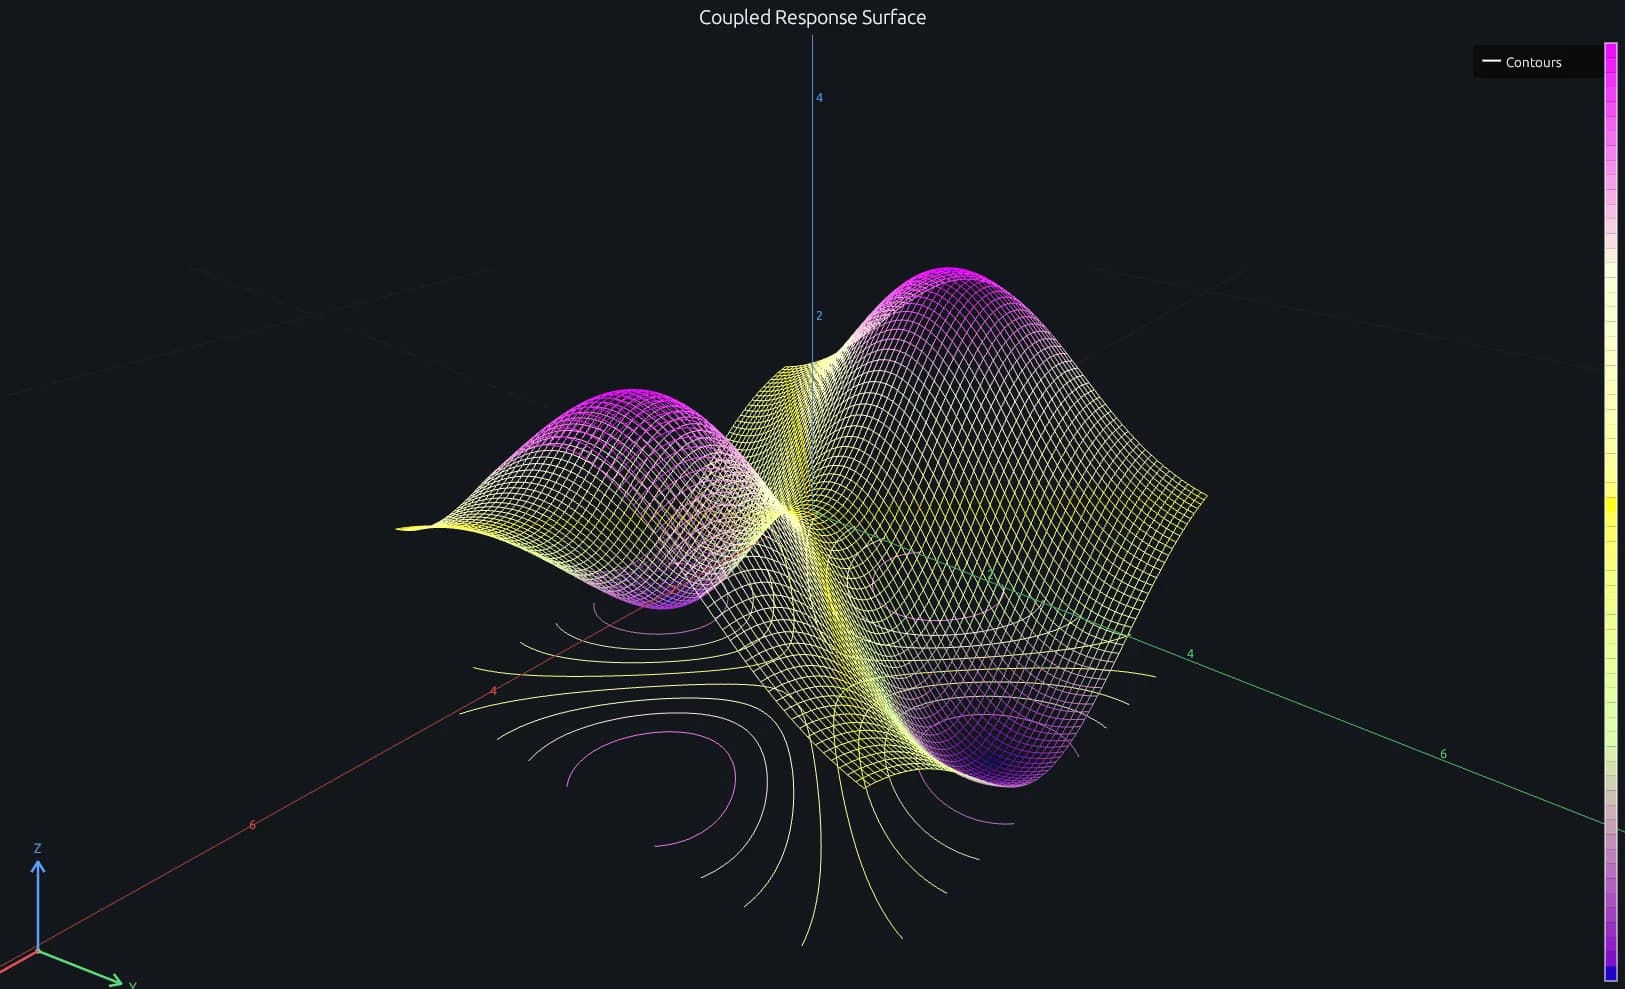
Compare this result with other chart types in the MATLAB Plot Gallery.
Using meshc with coding agents
Open a RunMat example with live inputs, then ask the agent to explain how meshc changes the result.
Run a small meshc example, explain the result, then change one input and compare the output.
FAQ
Where does the contour overlay appear in a meshc plot?⌄
The contour lines are projected onto the base plane beneath the wireframe, at the z-minimum of the axes. This gives you a top-down height map below the 3-D wireframe so you can read both the grid structure and the level sets at the same time.
What's the difference between meshc and mesh?⌄
mesh draws only the wireframe surface. meshc draws the same wireframe plus contour lines projected onto the base plane underneath. If you don't need the contour overlay, use mesh — it's the same surface rendering with less visual clutter.
Should I use meshc or surfc?⌄
Both add contour projections to the base plane. The difference is the surface itself: meshc uses a wireframe (transparent faces, grid lines only), while surfc uses a shaded, filled surface. Pick meshc when you want to see through the geometry, and surfc when you want a solid surface on top.
Related Plotting functions
2D Charts
area · bar · errorbar · heatmap · hist · histogram · loglog · pie · plot · scatter · semilogx · semilogy · stairs · stem
Other
addpoints · ancestor · animatedline · axes · barh · caxis · cla · clf · clim · colorcube · colororder · copyobj · daspect · datacursormode · dataTipTextRow · fcontour · figure · fill · fill3 · findobj · fsurf · gobjects · groot · hgload · hgsave · hidden · histogram2 · hold · line · linkaxes · openfig · opengl · pan · parula · patch · plotmatrix · plotyy · polarhistogram · polarplot · polarscatter · print · quiver3 · ribbon · saveas · savefig · sphere · stackedplot · subtitle · suptitle · text · textscatter · textscatter3 · triplot · waitbar · wordcloud · xlabel · xlim · xline · xscale · xtickangle · xtickformat · xticklabels · xticks · ylabel · ylim · yline · yscale · ytickangle · ytickformat · yticklabels · yticks · zlim · zoom
More plotting resources
Open-source implementation
Unlike proprietary runtimes, every RunMat function is open-source. Read exactly how meshc is executed, line by line, in Rust.
- View the source for meshc in Rust on GitHub
- Learn how the RunMat runtime works
- Found a bug? Open an issue with a minimal reproduction.
About RunMat
RunMat is an open-source runtime that executes MATLAB-syntax code blazing on any GPU. It is licensed under the Apache 2.0 license.
- RunMat automatically optimizes your math for GPU execution on Apple, Nvidia, and AMD hardware. No code changes needed. Simulations that took hours now take minutes.
- Start running code in seconds. RunMat runs in the browser, on the desktop, or from the CLI. No license server, no IT ticket.