Choose a polynomial degree
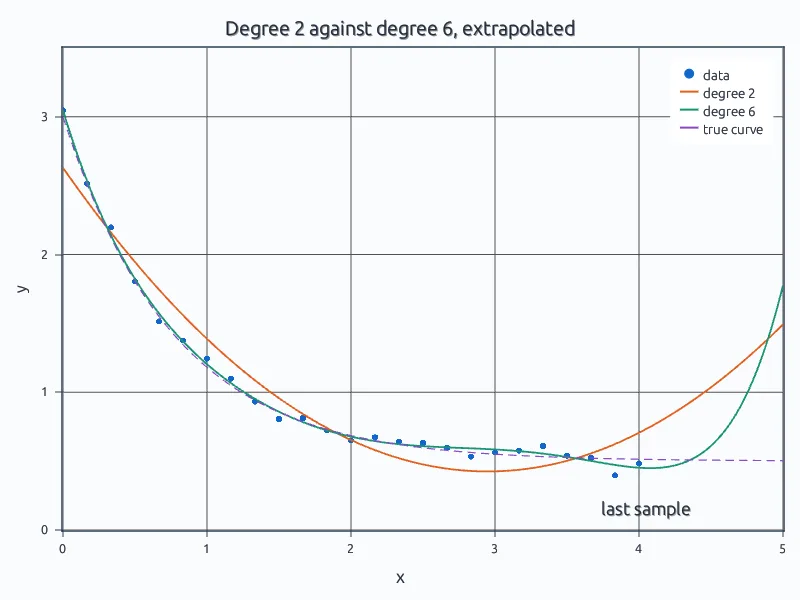
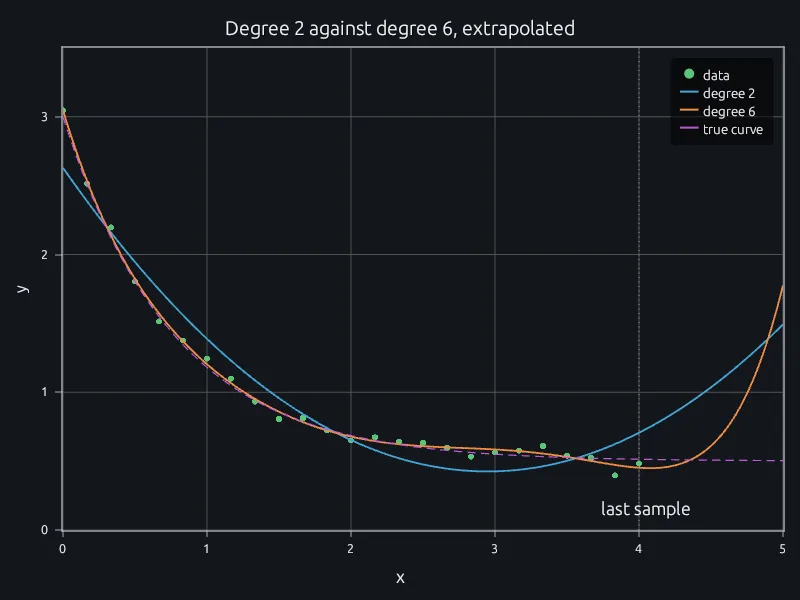
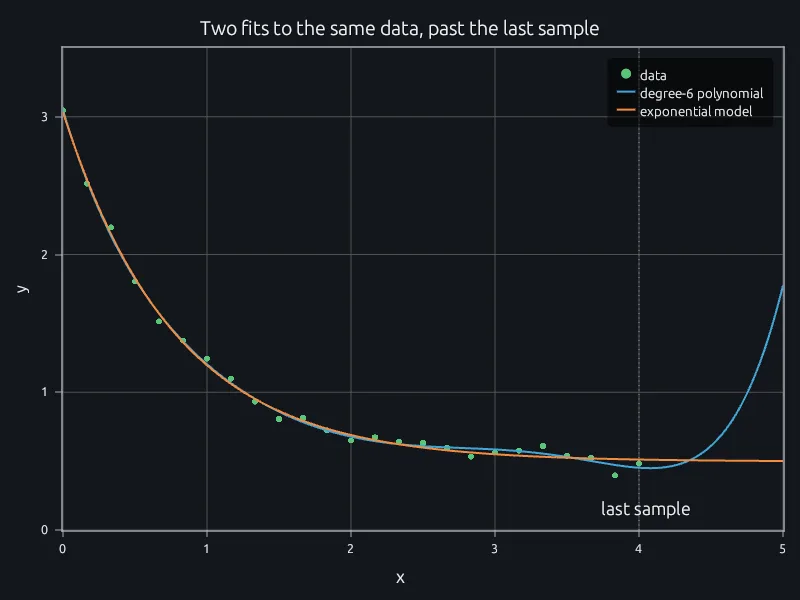
Degrees 1 to 6 by R-squared, then both fits past the data.
Fit models to measurements and fill in between samples with polyfit, lsqcurvefit, interp1, spline, interp2 and the other fitting functions you already know.
Bounded nonlinear fits usually mean paying for an optimization toolbox, or waiting for a shared license to free up. lsqcurvefit and lsqnonlin fit with bounds as part of the RunMat runtime, next to polyfit and interp1, free for individuals, education, research and smaller companies.
RuntimeFitting one curve per sensor, batch or test run in a plain loop keeps a single core busy while the rest sit idle. A parfor loop spreads the fits across every core and returns the same parameters at any worker count.
ParallelEach run keeps its script, data and figures, so next week's measurements go through the same fit and the two sets of parameters can be compared side by side.
Desktop appScreenshots of a fit lose the data behind them. Open the project together and both people see the same figures and residuals, with each other's pointer on the plot, while the model changes.
CollaborationDegrees 1 to 6 by R-squared, then both fits past the data.
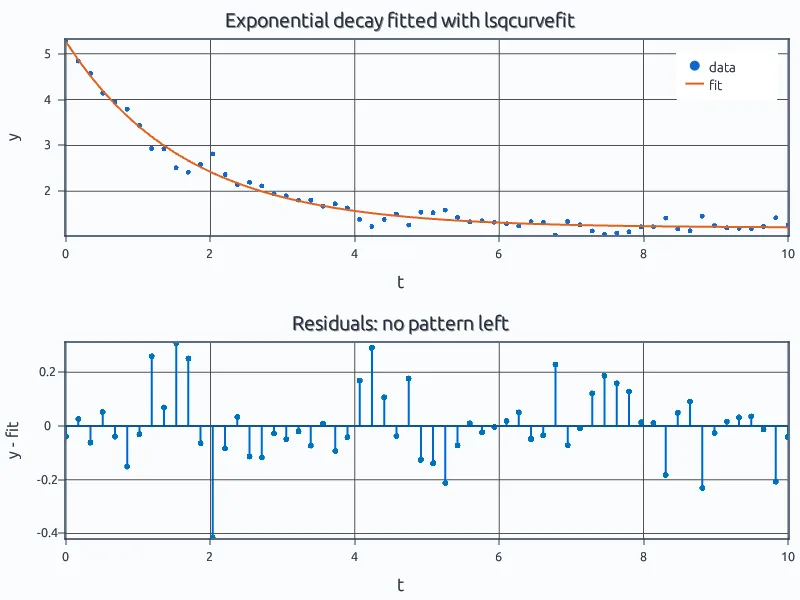
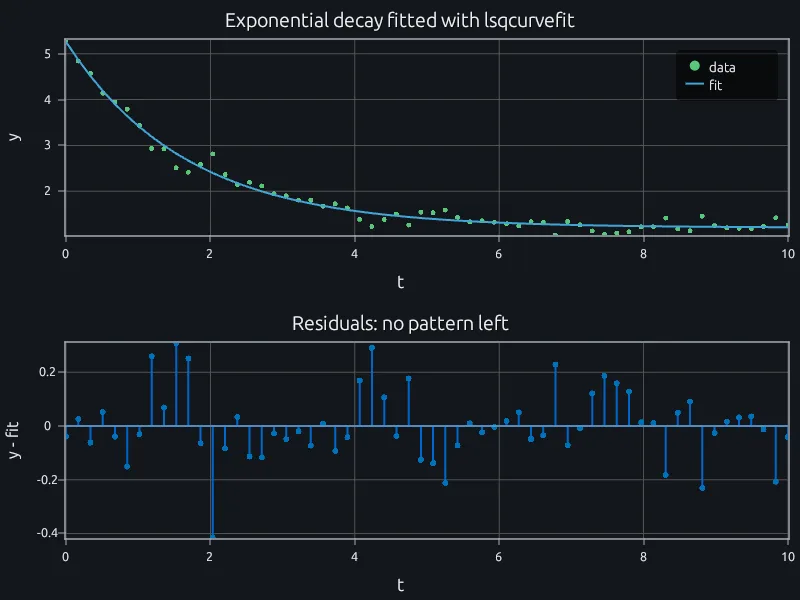
Amplitude, rate and offset with bounds and 95% intervals.
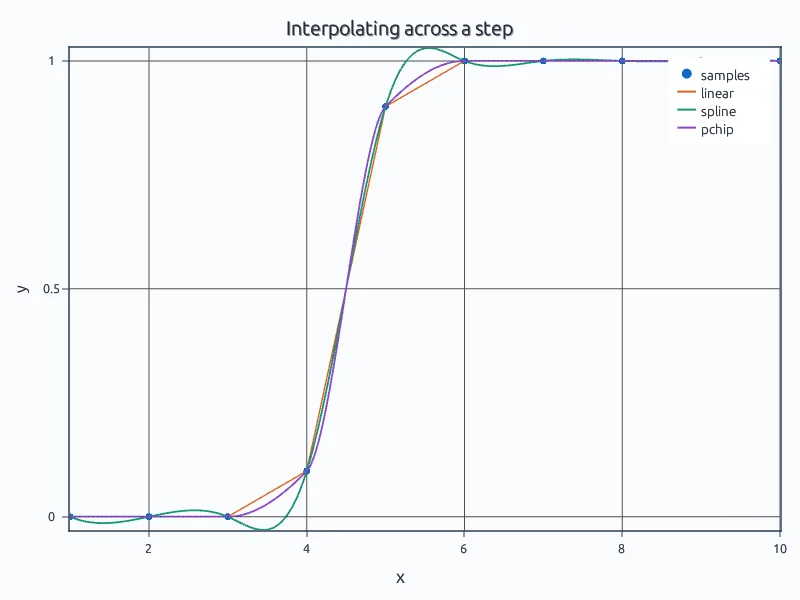
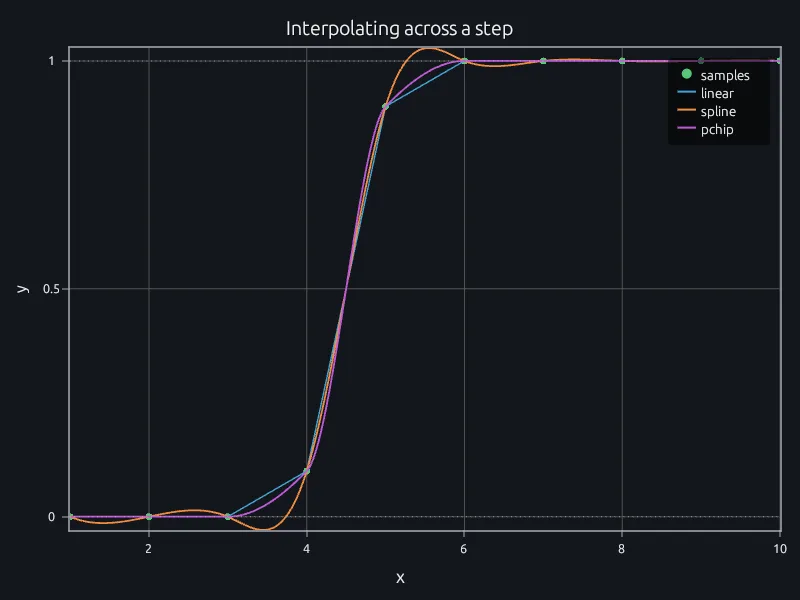
Three interpolants across a step, and where spline overshoots.
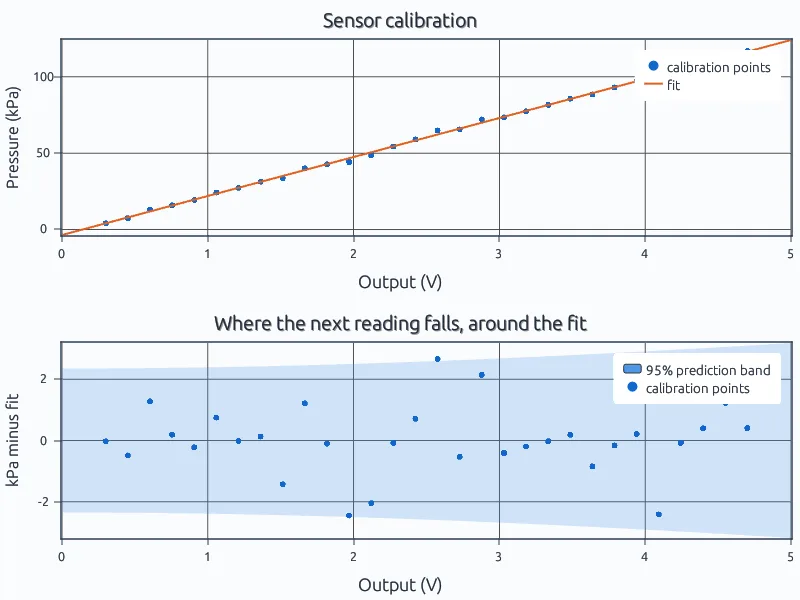
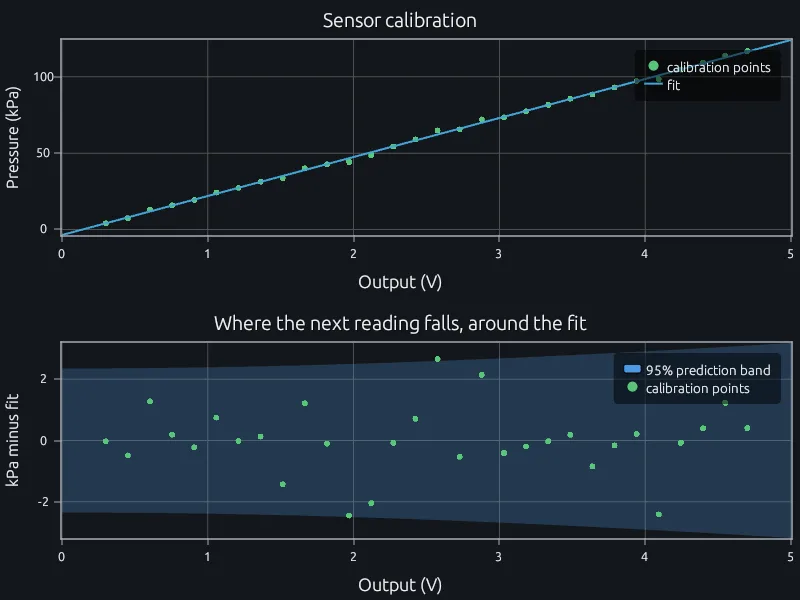
A straight-line fit and where the next reading will fall.
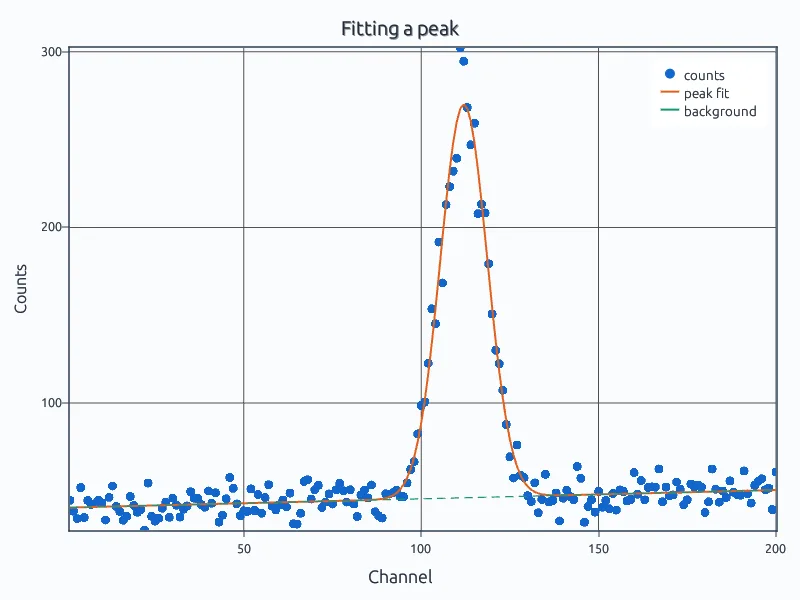
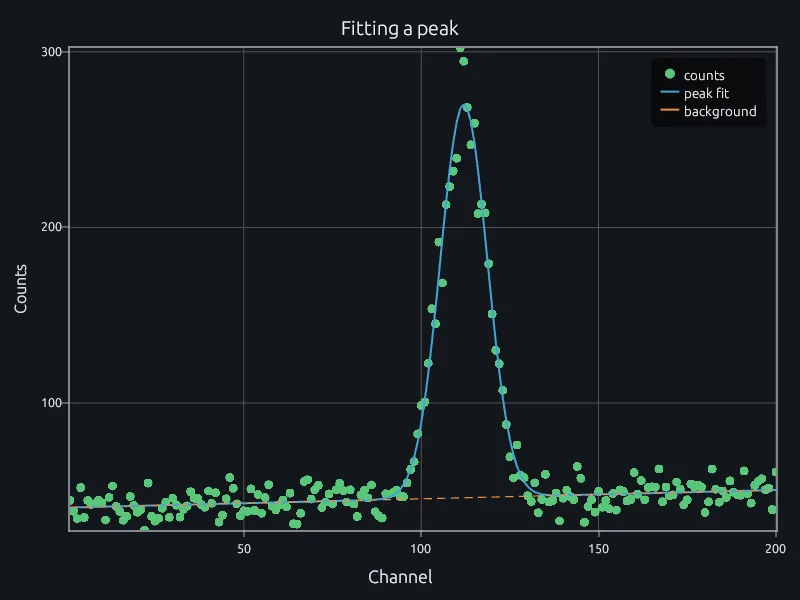
Center, width and height of a peak on a sloping background.
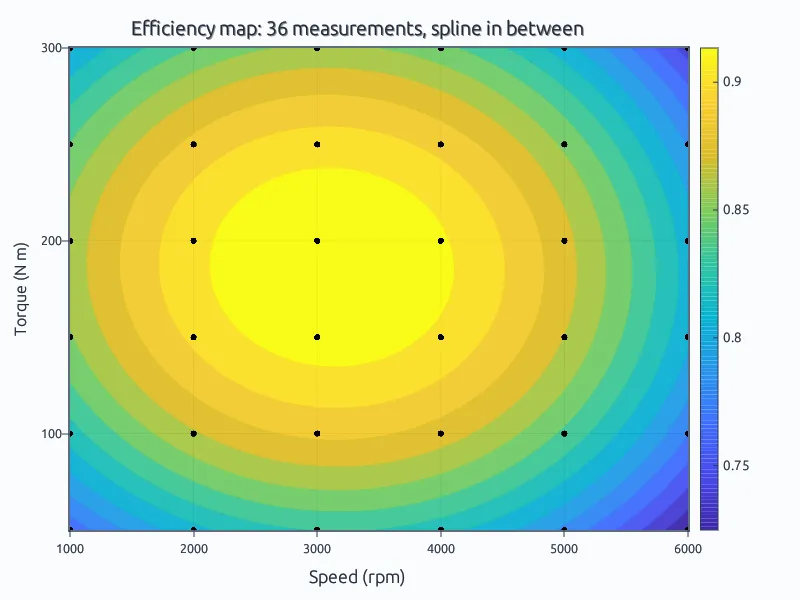
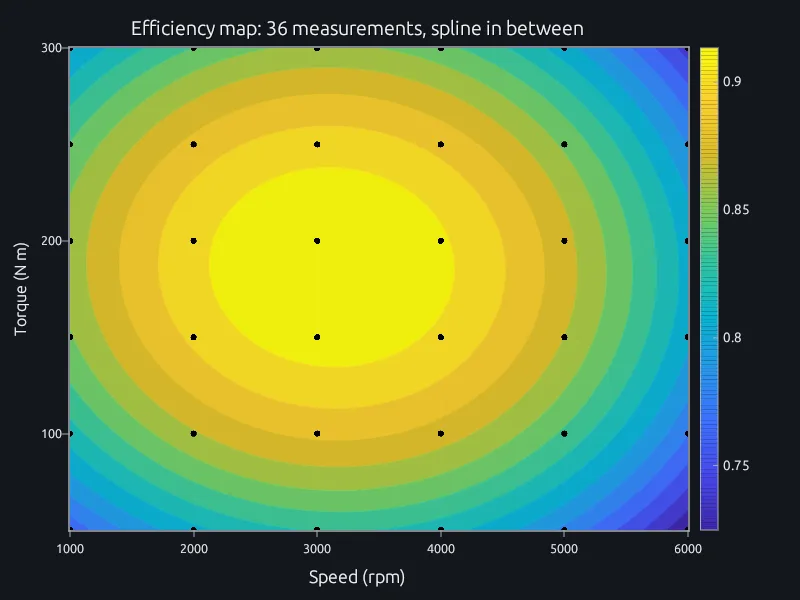
A coarse efficiency map filled in with a 2-D spline.