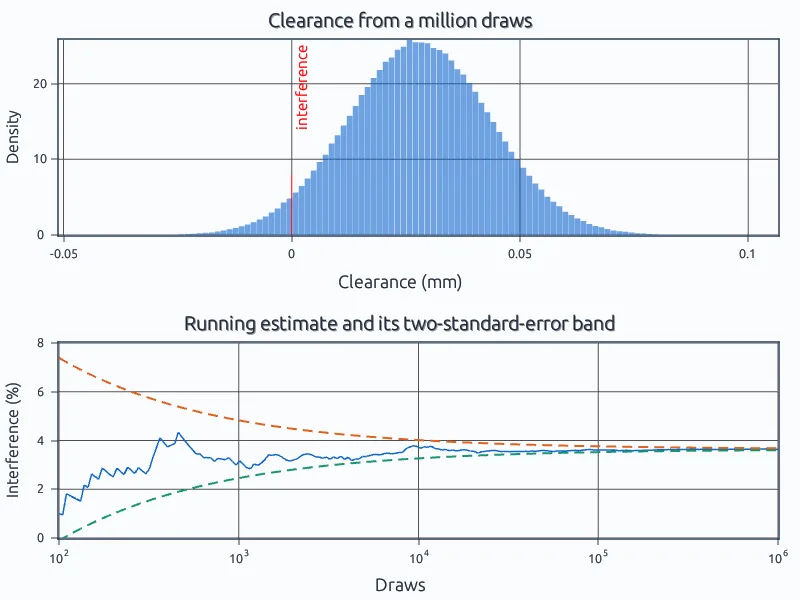
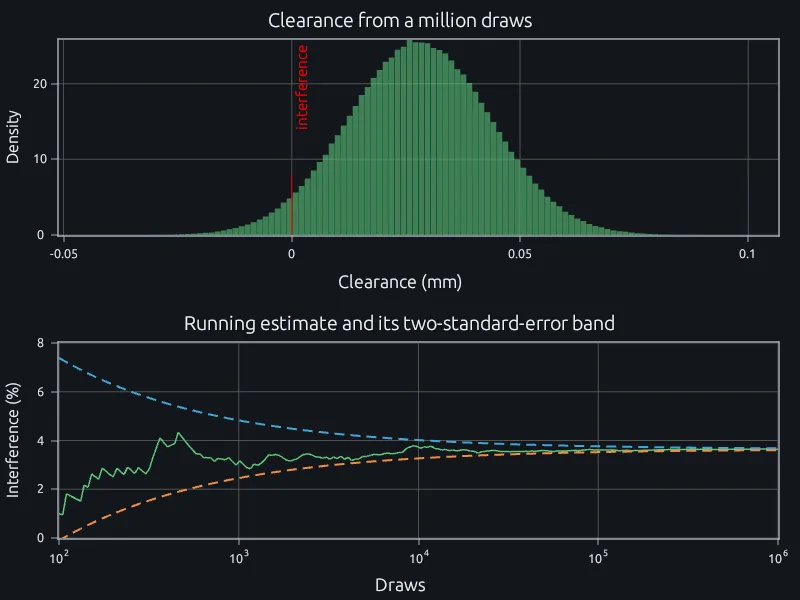
Monte Carlo tolerance stack-up
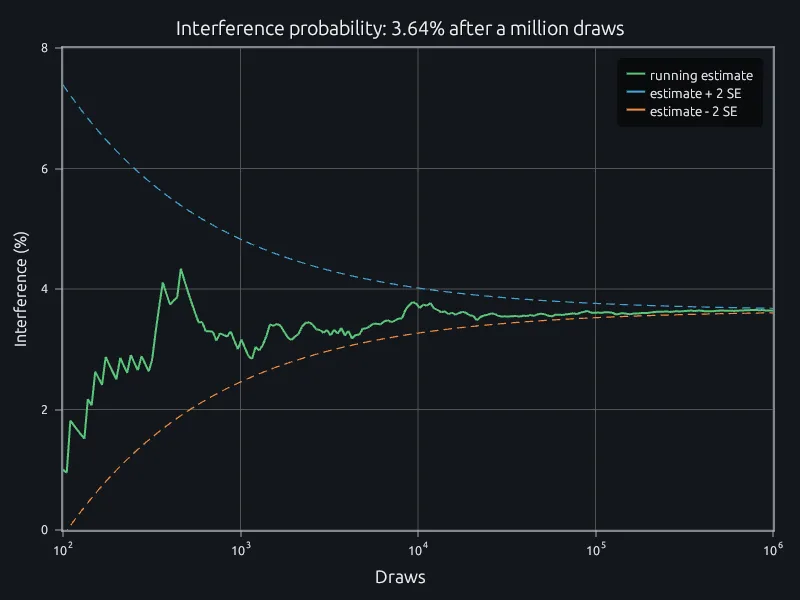
A shaft in a bore: interference probability, its standard error and when to stop.
Describe samples, fit distributions, test differences and run Monte Carlo studies with mean, fitdist, ttest2, bootstrp, fitlm and the other statistics functions you already know.
Fitting a distribution or running a t-test usually means paying for a statistics toolbox, or waiting for a shared license. fitdist, ttest2, bootstrp, fitlm and the distribution functions are part of the RunMat runtime next to mean and histogram, free for individuals, education, research and smaller companies.
RuntimeSimulation studies are usually limited by how many draws fit in the time available. rand, randn, mean, std and cumsum run on the GPU when the arrays are large, so the same vectorized script runs far more draws and gives tighter intervals.
GPUA result that changes on each run can't be checked by anyone else. rng(seed) repeats a run exactly in RunMat, and each run keeps its script, data and figures.
Desktop appA reviewer can open the same .m file in the browser with nothing to install and get the same numbers from the same seed, or open the project on the desktop alongside you.
CollaborationA shaft in a bore: interference probability, its standard error and when to stop.
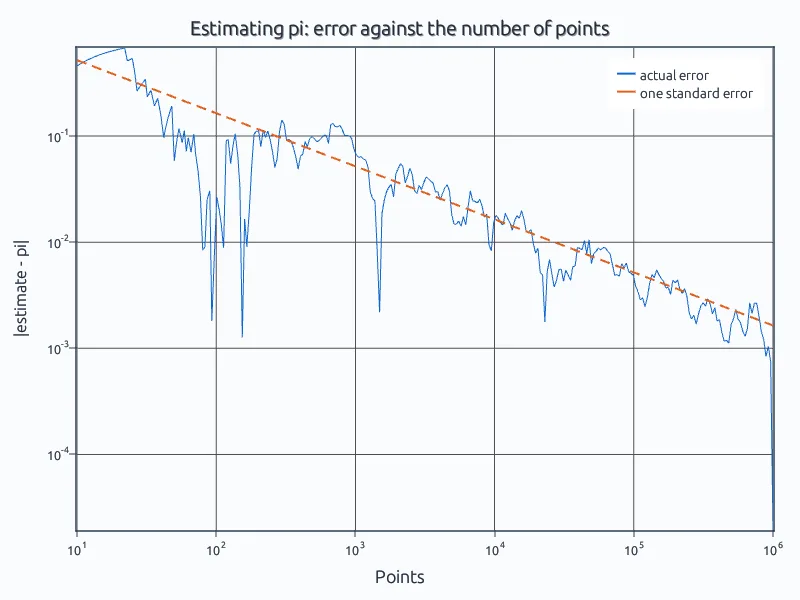
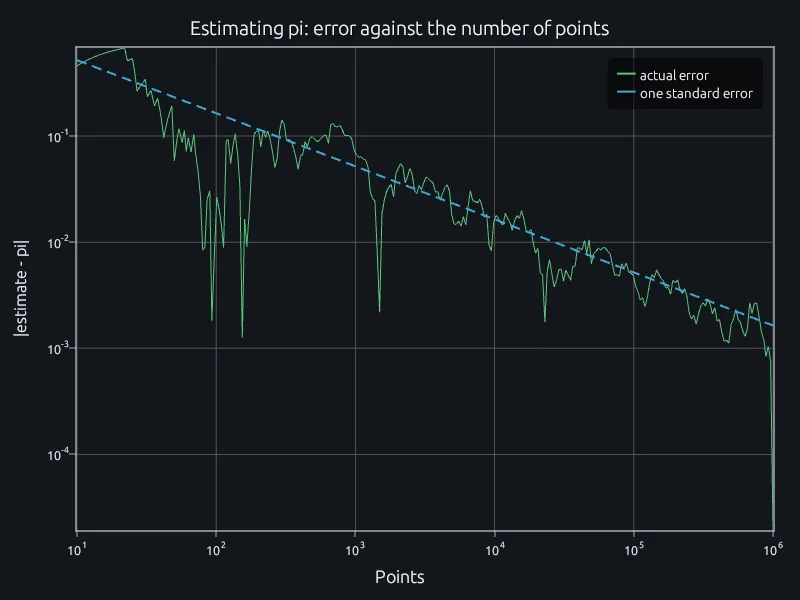
The smallest Monte Carlo study, with its error at every sample size.
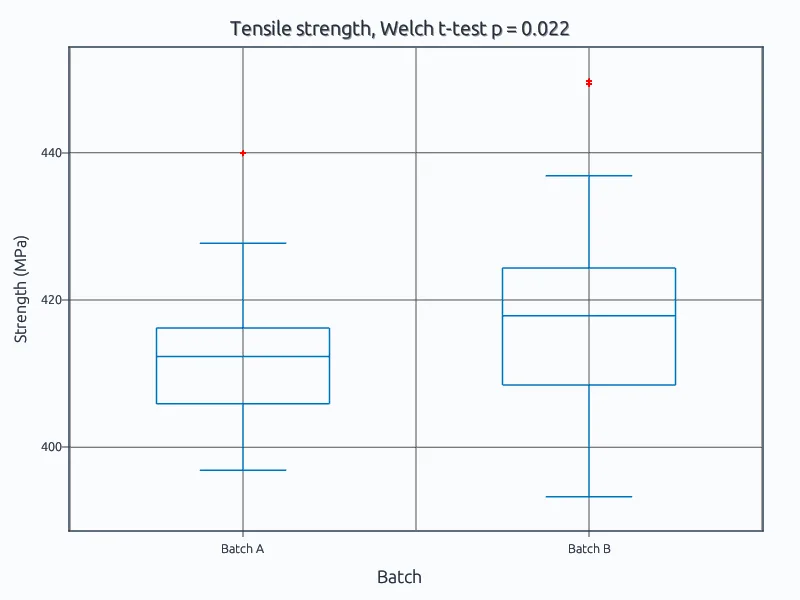
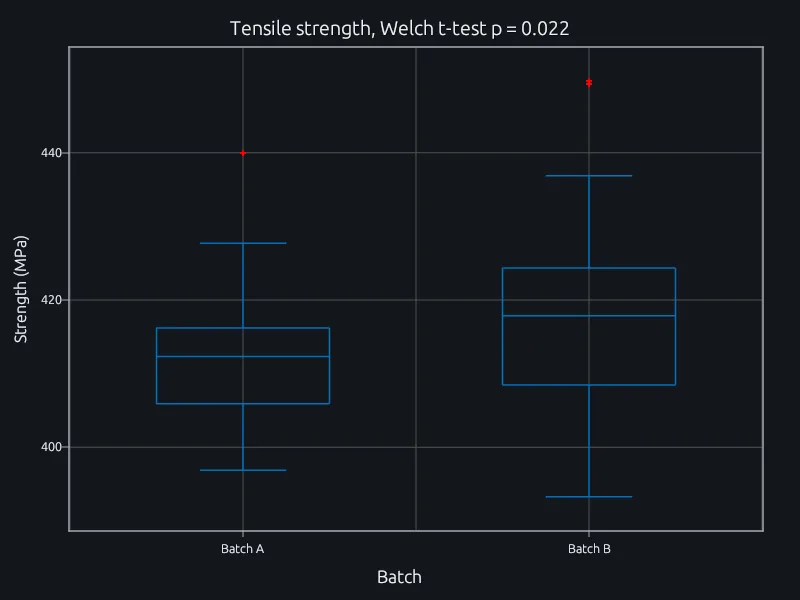
Box plots, a Welch t-test and the interval on the difference.
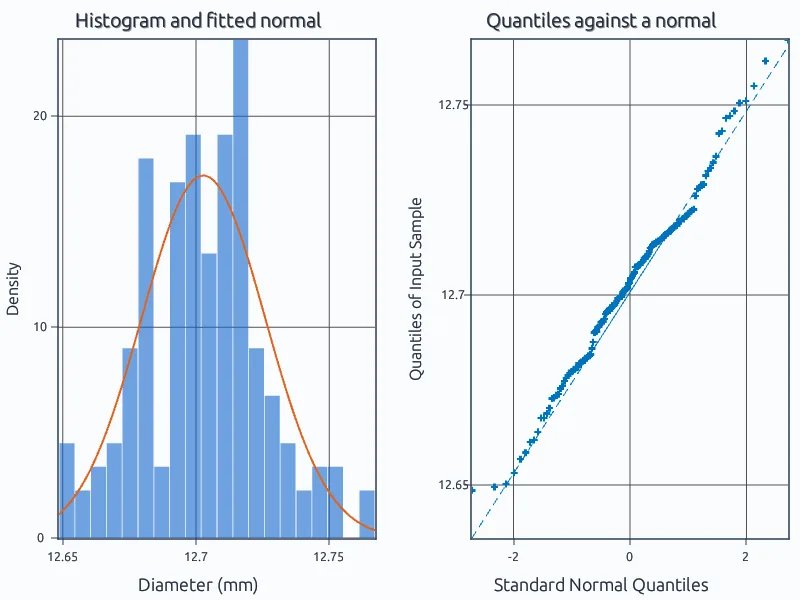
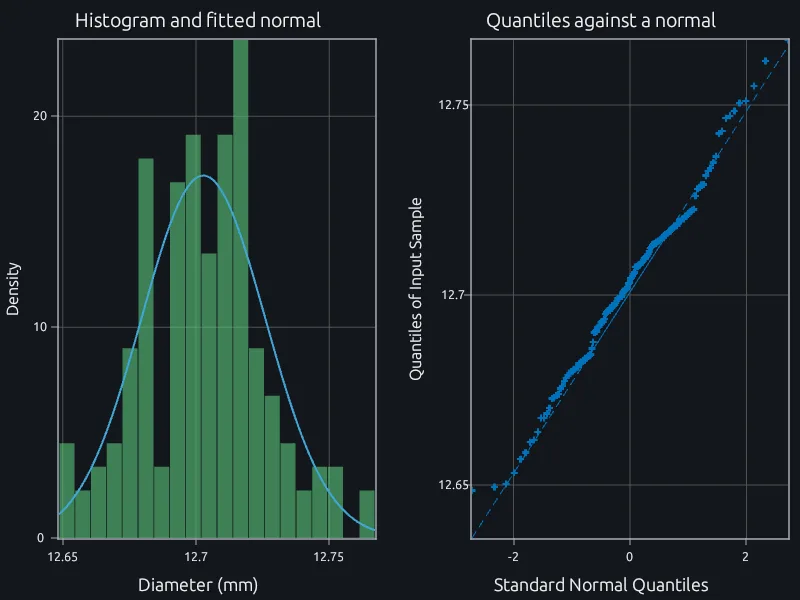
A normal fit over the histogram, a QQ plot and a KS test.
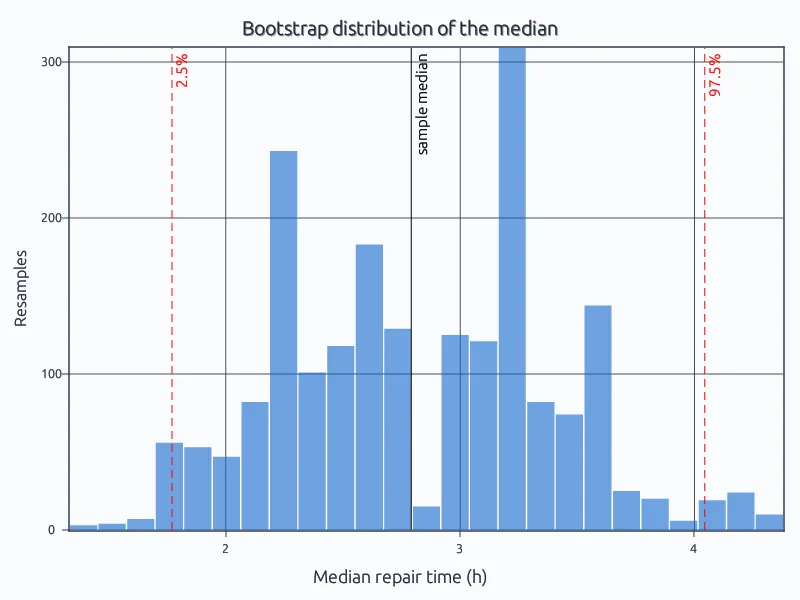
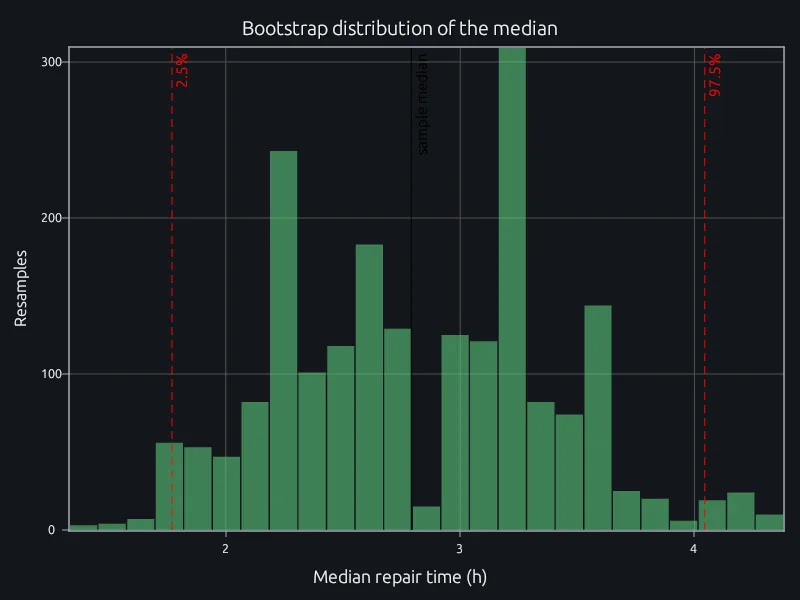
Two thousand resamples of a skewed sample and a percentile interval.
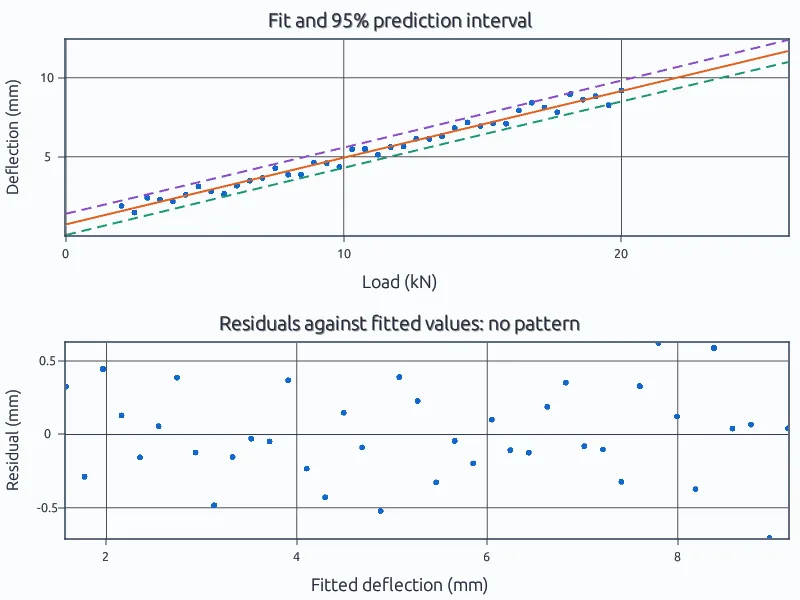
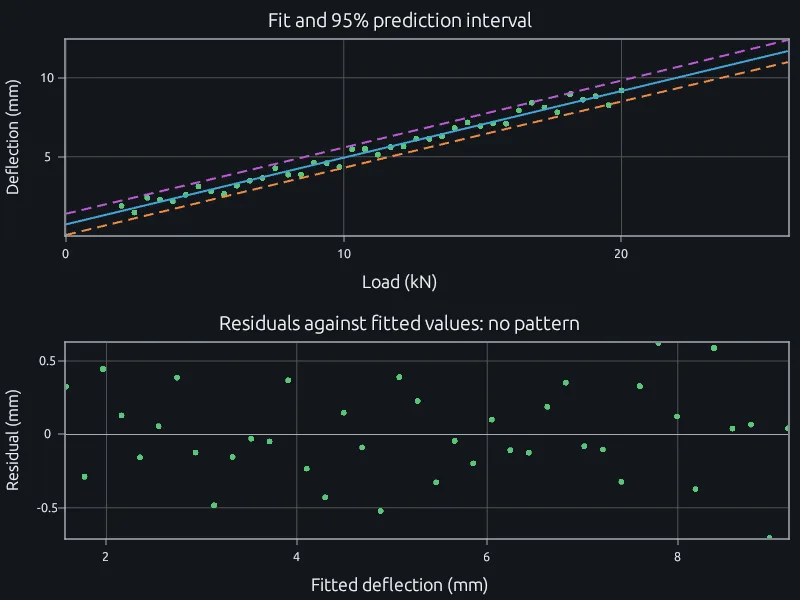
A fitted line, a prediction interval and the residuals that judge it.
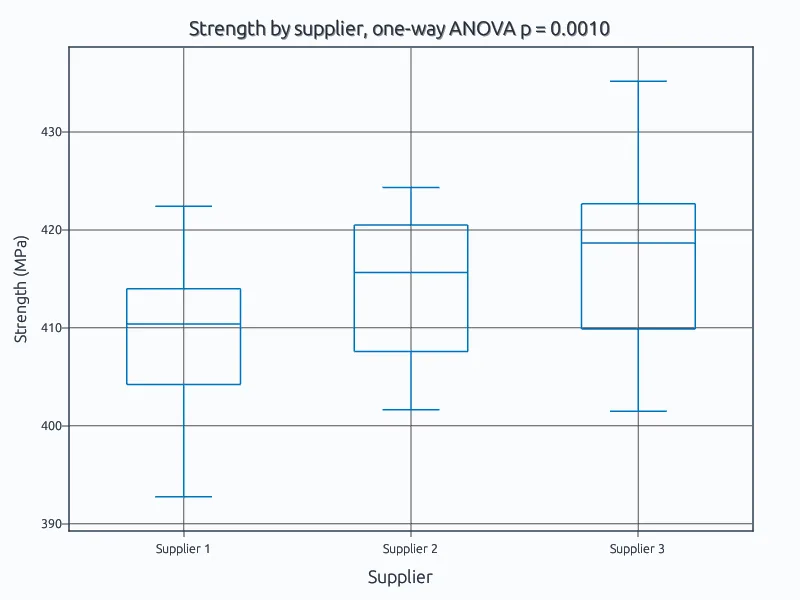
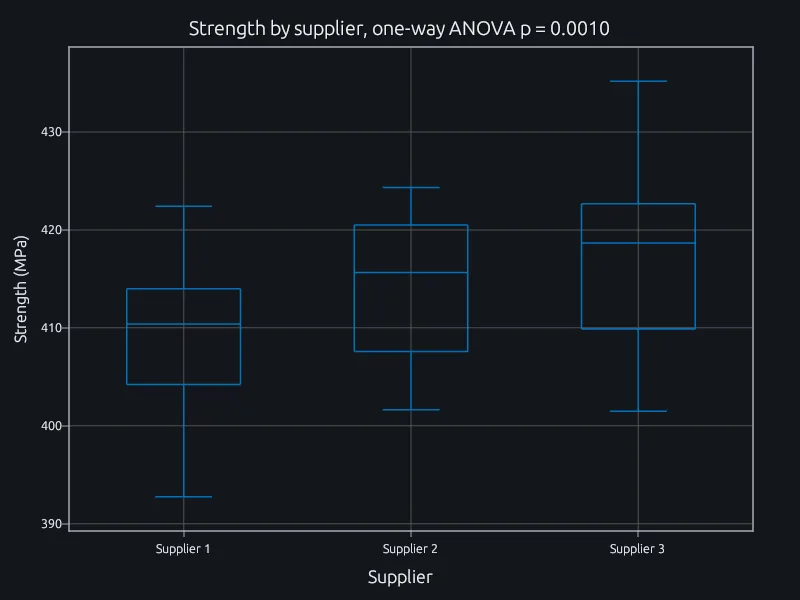
One-way ANOVA across three groups, with the F test and group means.
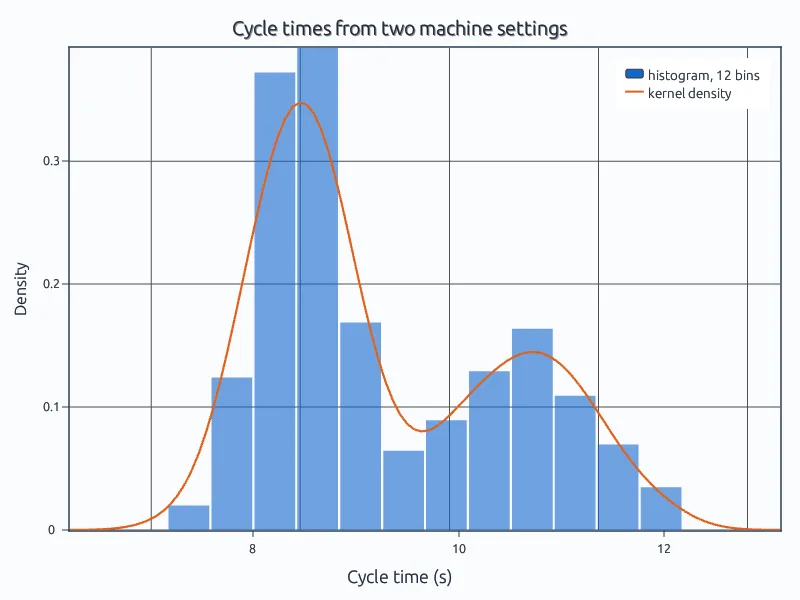
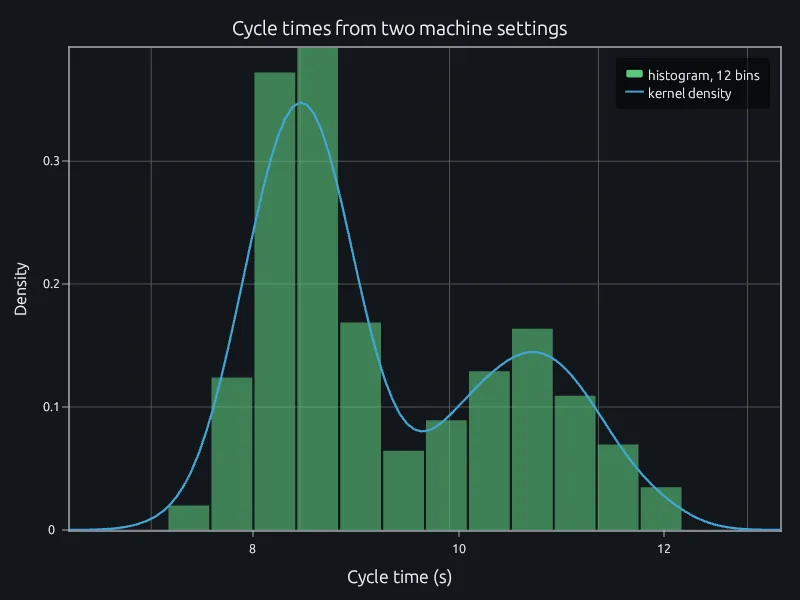
A kernel density estimate that finds the peaks a histogram blurs.
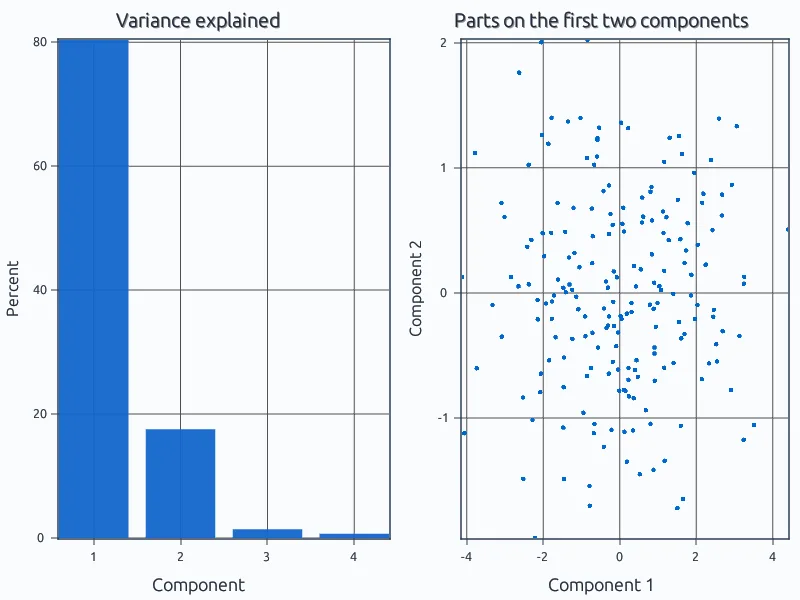
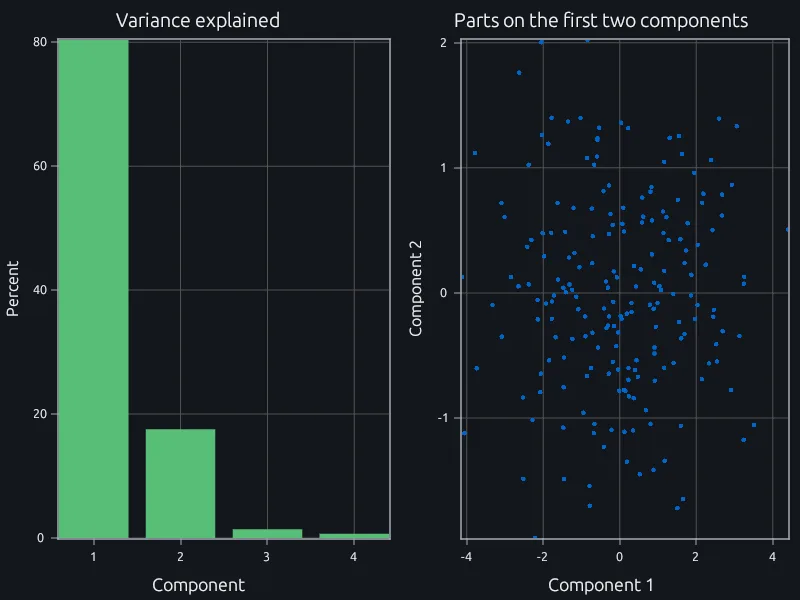
Which directions carry the variance in four correlated sensors.