Messy CSV to a clean table
Preamble lines, a units row, N/A and two date formats, read right.
Read, clean, summarize and write data with readtable, fillmissing, groupsummary, pivot, writetable and the other table functions you already know.
A log can be analyzed on the rig PC or a field laptop with no license server to reach. readtable, groupsummary, fillmissing and the date functions are part of the RunMat runtime, free for individuals, education, research and smaller companies.
RuntimeCopying logs into another tool adds a step to every test day. On the desktop, a script reads CSV, Excel, JSON and HDF5 files from their folders on disk, so the analysis runs where the data already is.
Desktop appA number column read as text skews a summary without raising an error. Every table and timetable opens in the variable viewer beside the code, with its column names, types and units, so the bad column shows up before it reaches a report.
Plots and variablesWhen a figure in a report is questioned months later, the data and code behind it are hard to find. Each run keeps its tables, figures and code, so the summary opens again with the data it came from.
Desktop appPreamble lines, a units row, N/A and two date formats, read right.
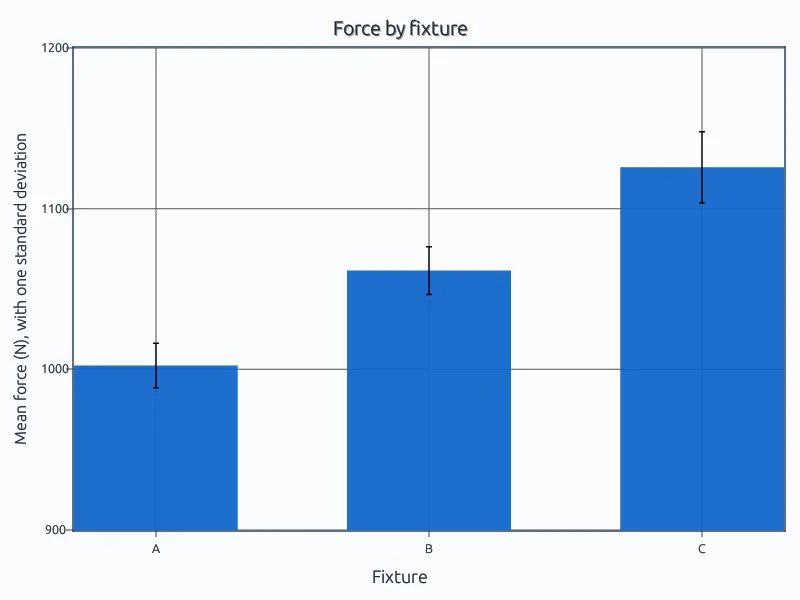
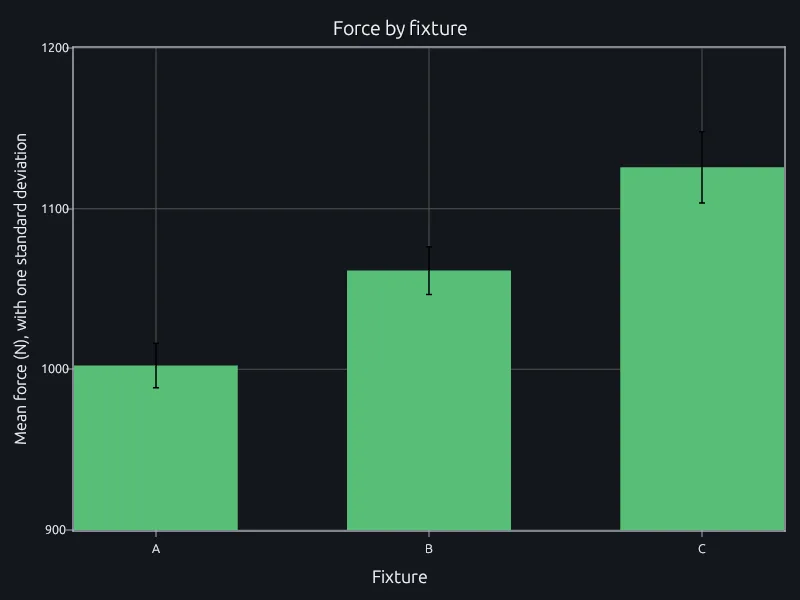
Mean and spread of force per fixture with groupsummary.
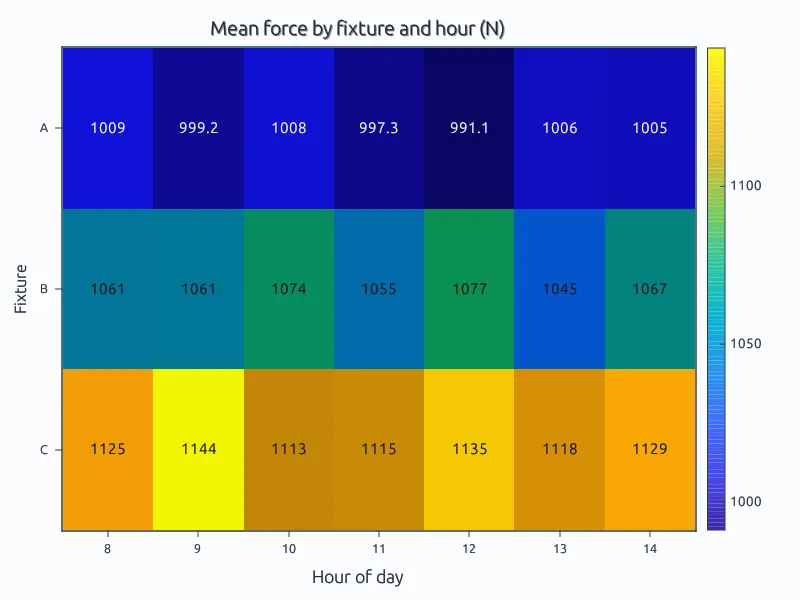
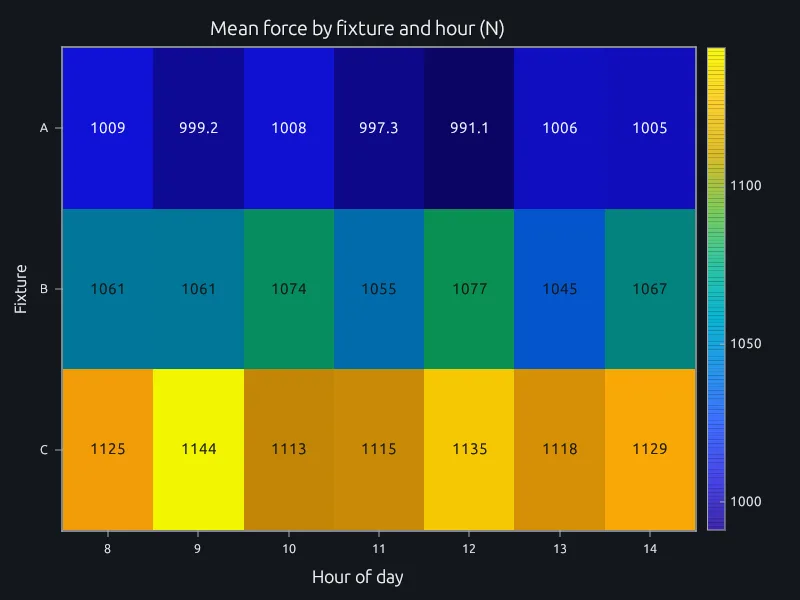
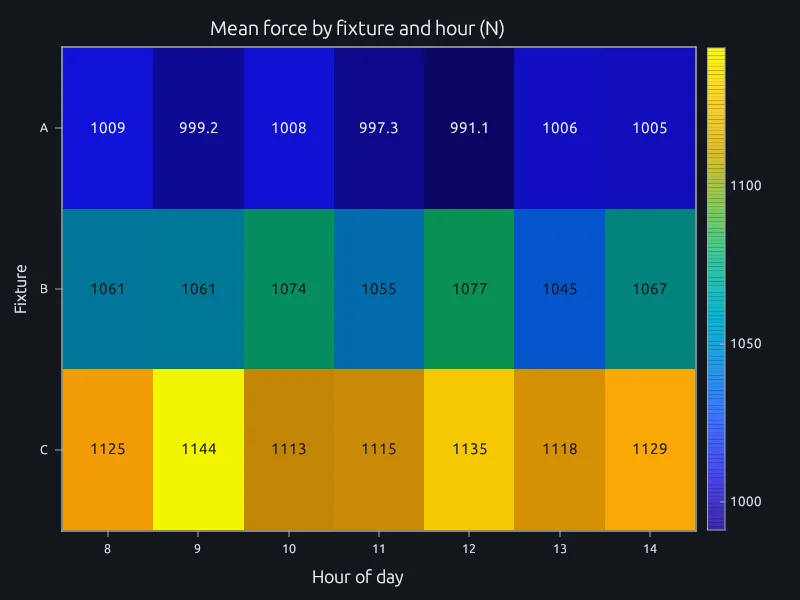
Fixture by hour as a grid of means, drawn as a heatmap.
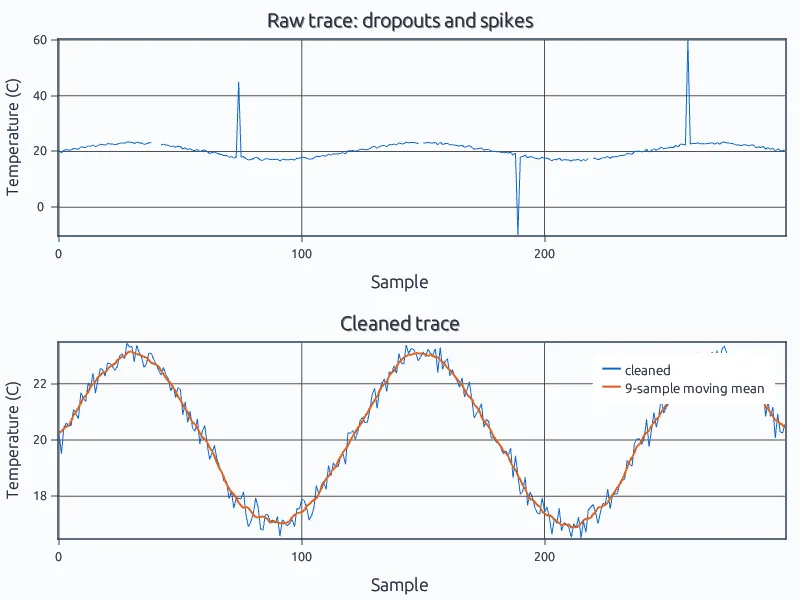
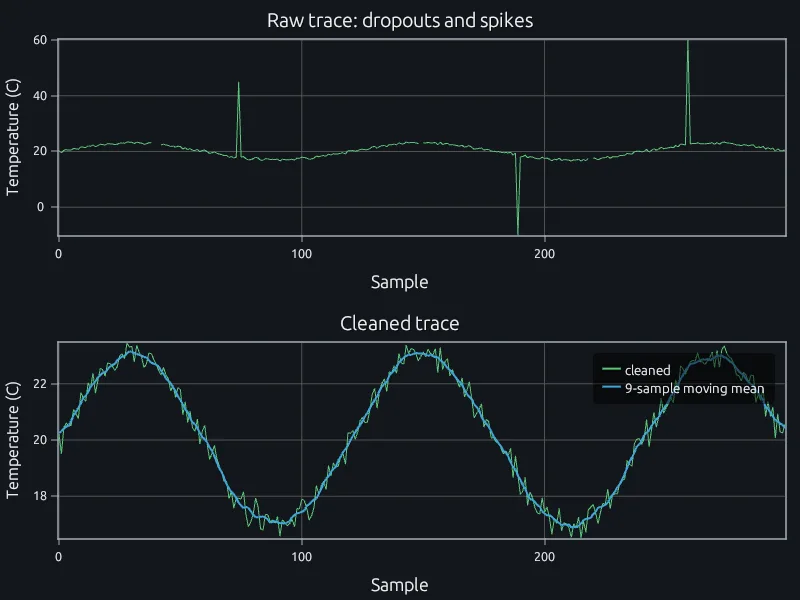
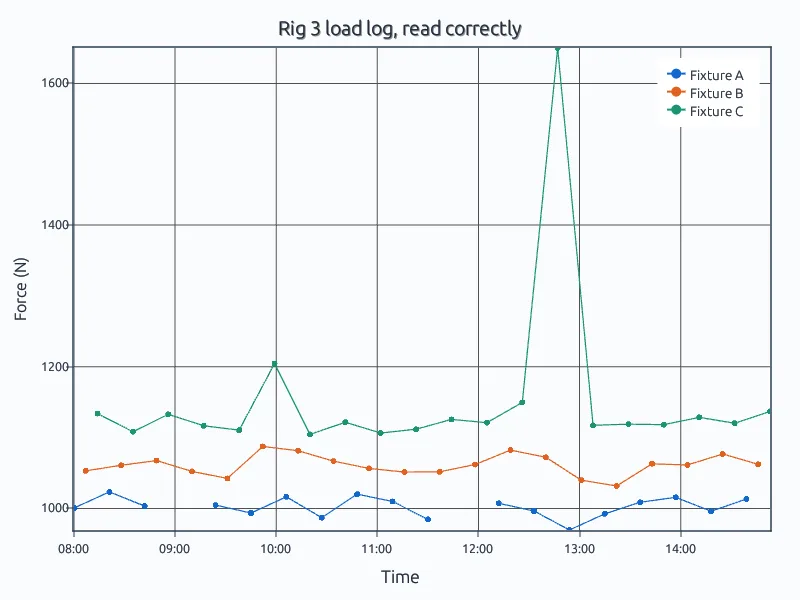
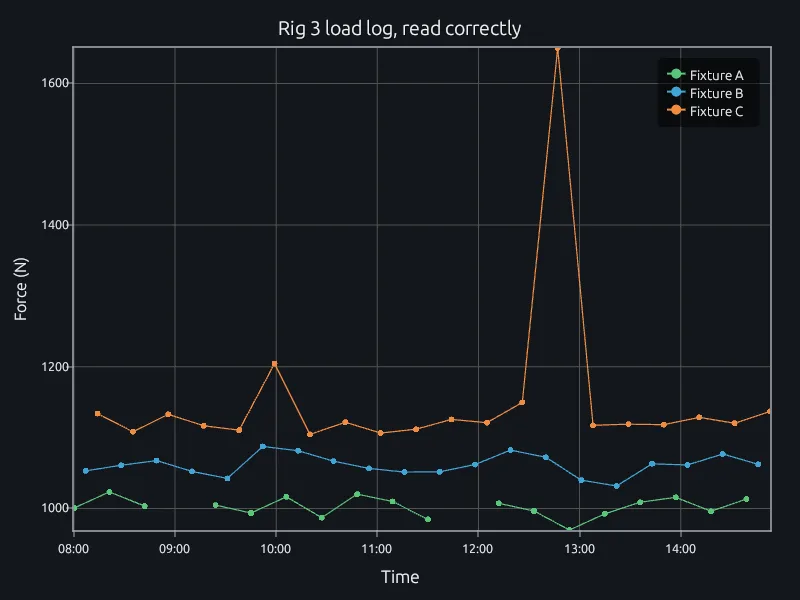
Fill dropouts and replace spikes, then compare before and after.
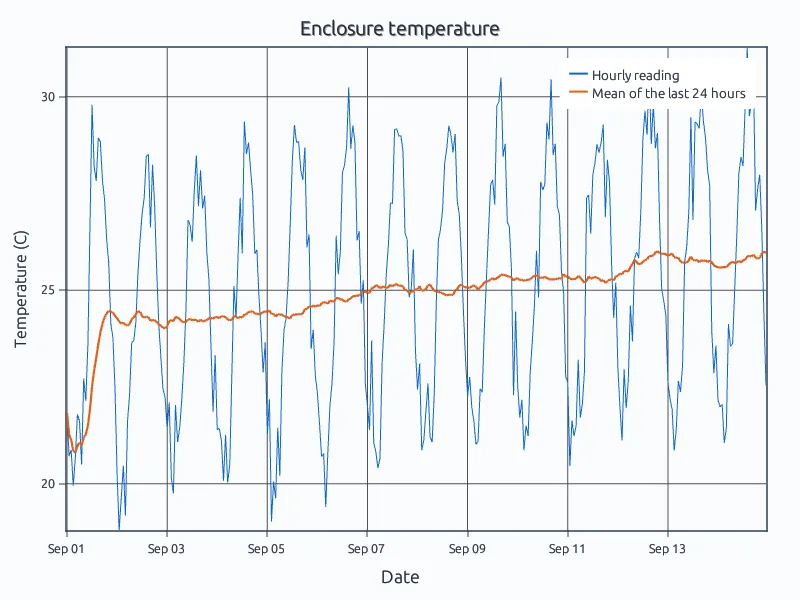
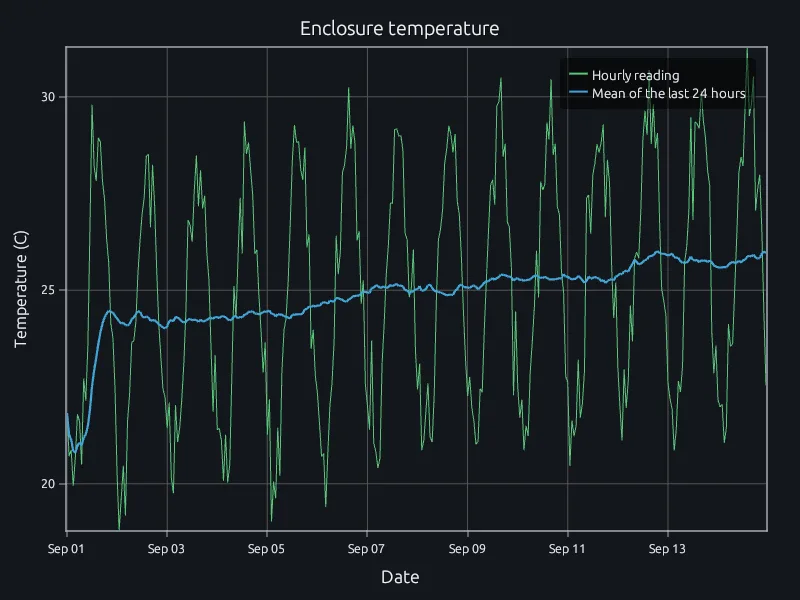
Two weeks of hourly readings in a timetable, on a time axis.
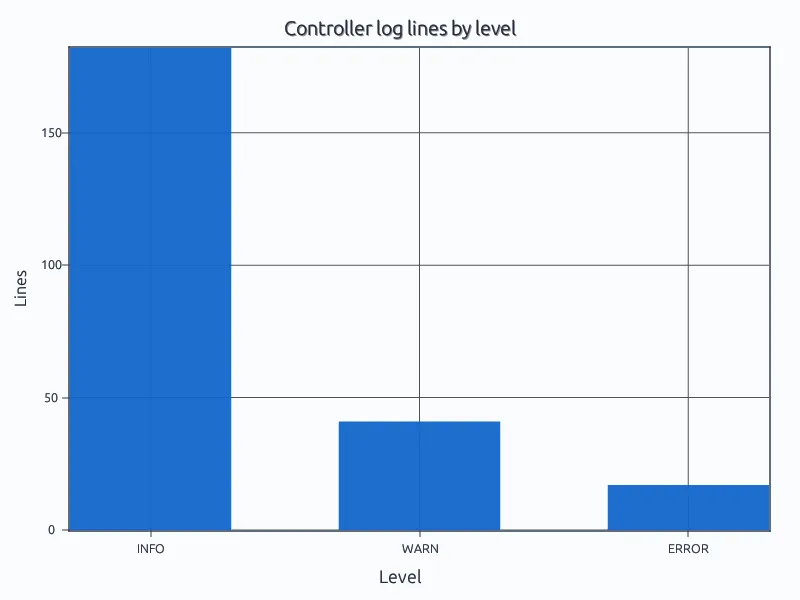
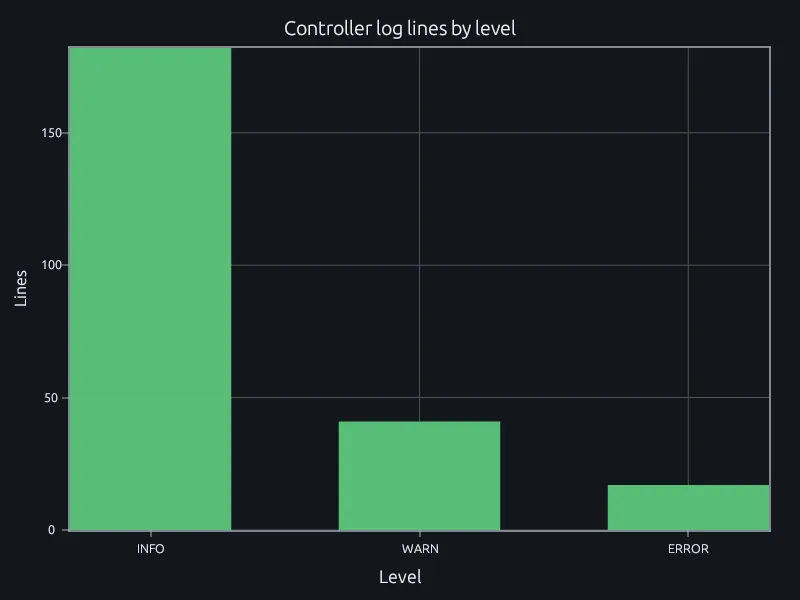
Pull levels and loads out of log lines, then count by level.