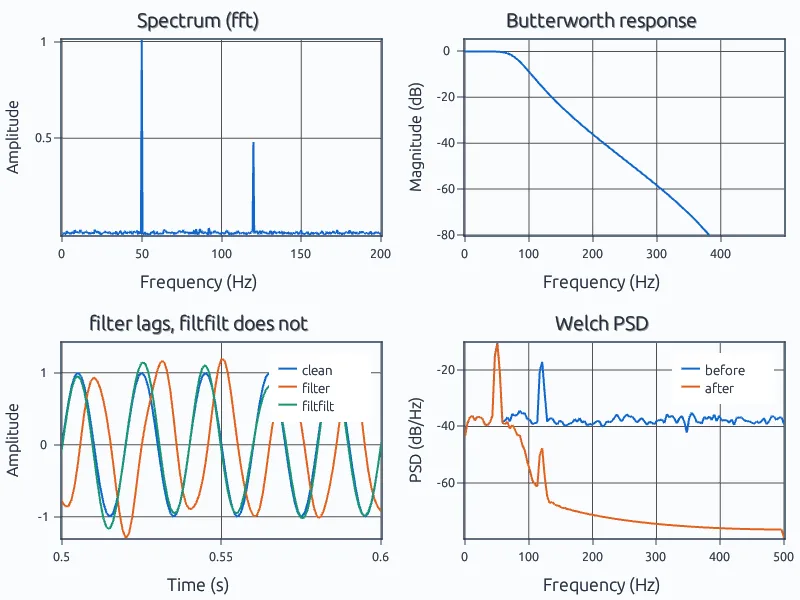
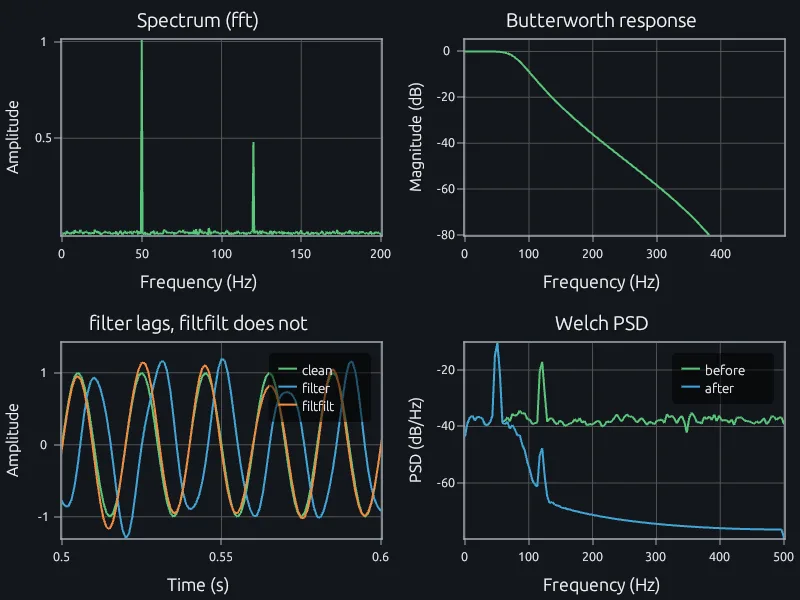
Remove a tone from a noisy signal
Low-pass it, then compare filter with filtfilt.
Filter, analyze and plot sampled signals with fft, pwelch, spectrogram, butter, filtfilt and the other signal processing functions you already know.
Designing a filter or computing a Welch spectrum usually means paying for a signal processing toolbox, or waiting for a shared license. butter, fir1, filtfilt, pwelch and spectrogram are part of the RunMat runtime, free for individuals, education, research and smaller companies.
RuntimeLong recordings and high sample rates make FFTs and spectrograms the slow step. fft, conv, pwelch and spectrogram run on NVIDIA, AMD, Intel and Apple GPUs from the same script, so far more data goes through the same analysis with no GPU code to write.
GPUOpening each new recording by hand to run the same analysis costs time on every test day. Run the script from the command line over a folder of recordings, or in CI on each new batch, with no license server to activate.
CLI, CI and containersEach run keeps its figures, variables and code, so two filter designs can be compared without rerunning either. Colleagues can open the same project and see changes as they are made.
Desktop appLow-pass it, then compare filter with filtfilt.
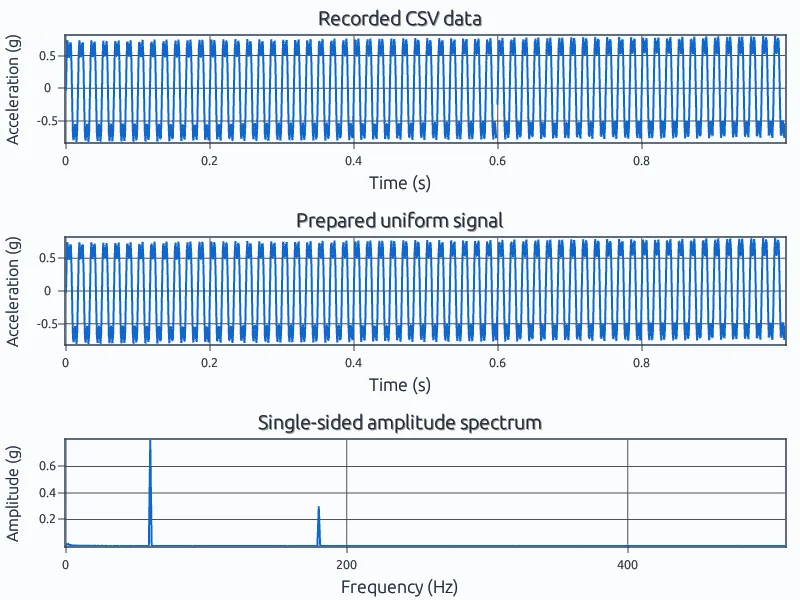
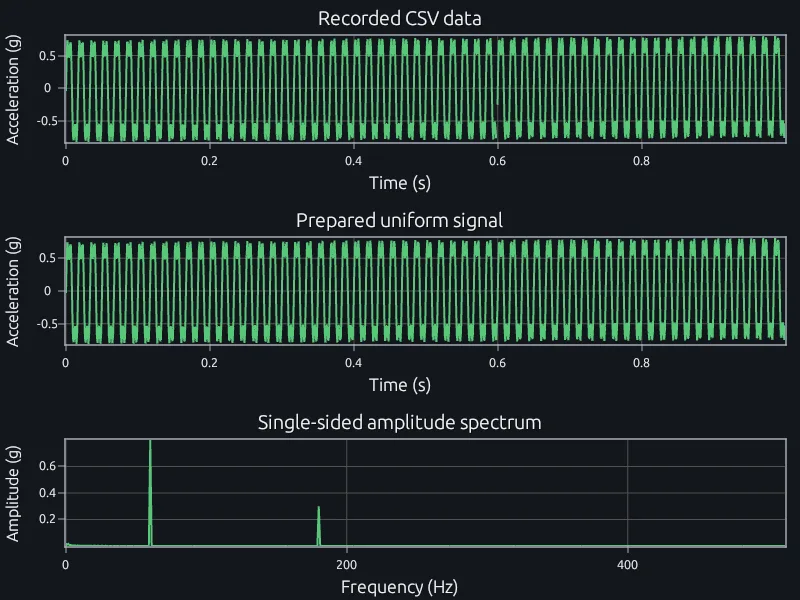
Fix gaps, resample to a uniform grid, then read the spectrum.
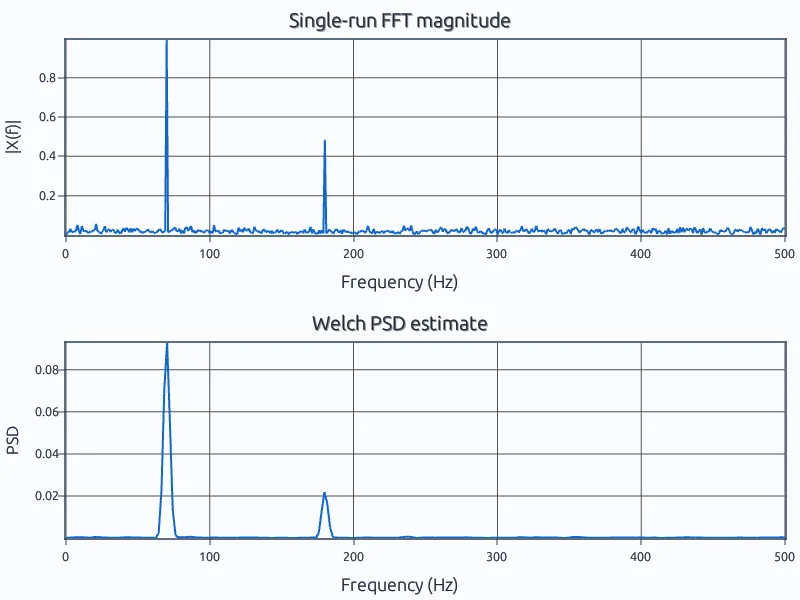
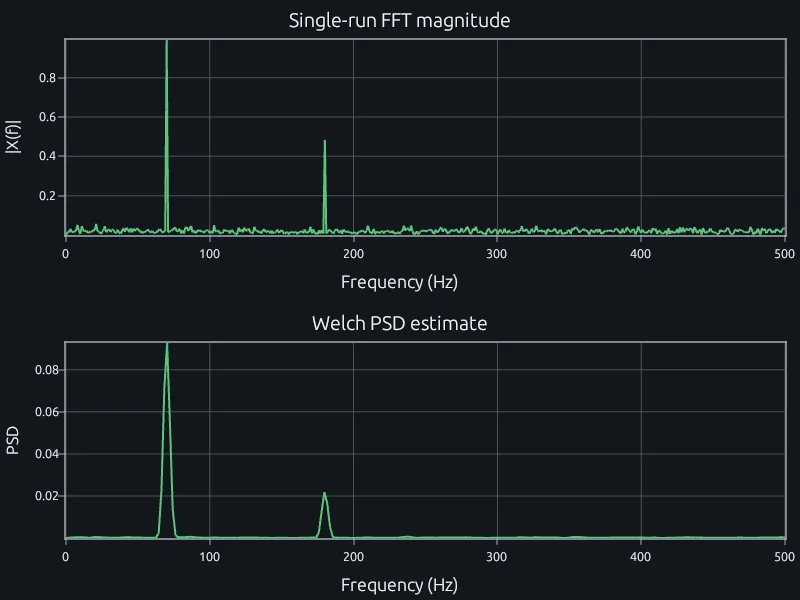
See what averaging does to the noise floor.
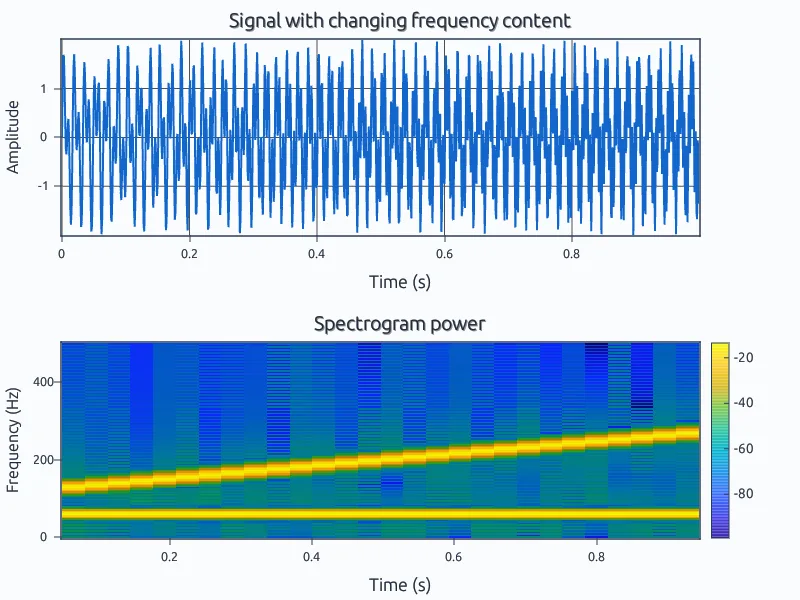
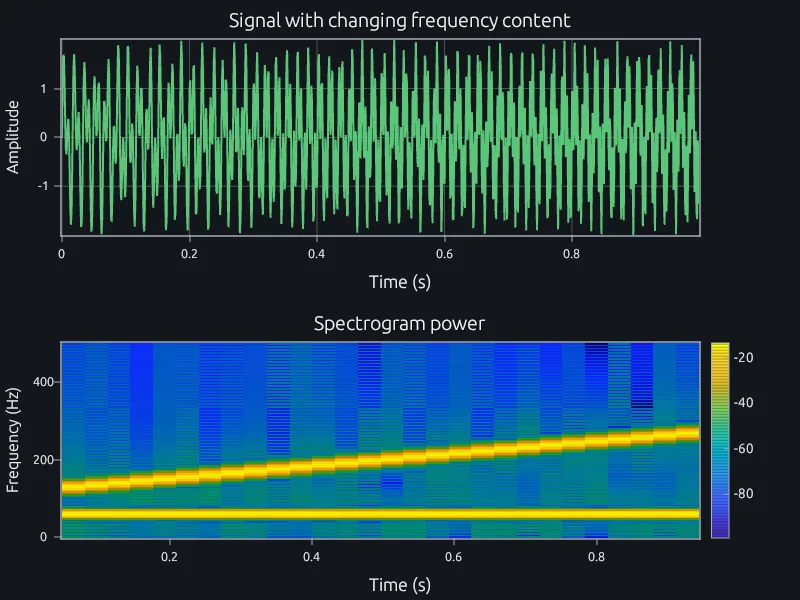
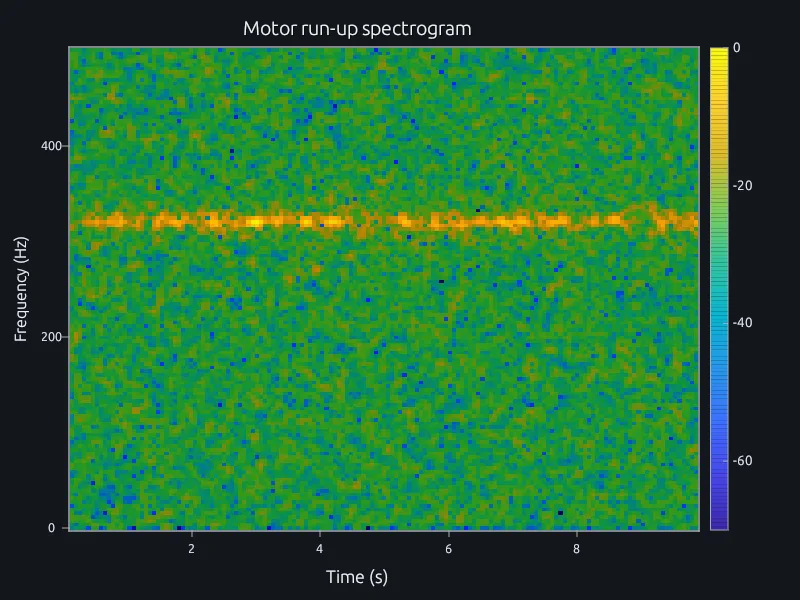
A rising tone and a steady one, seen over time.
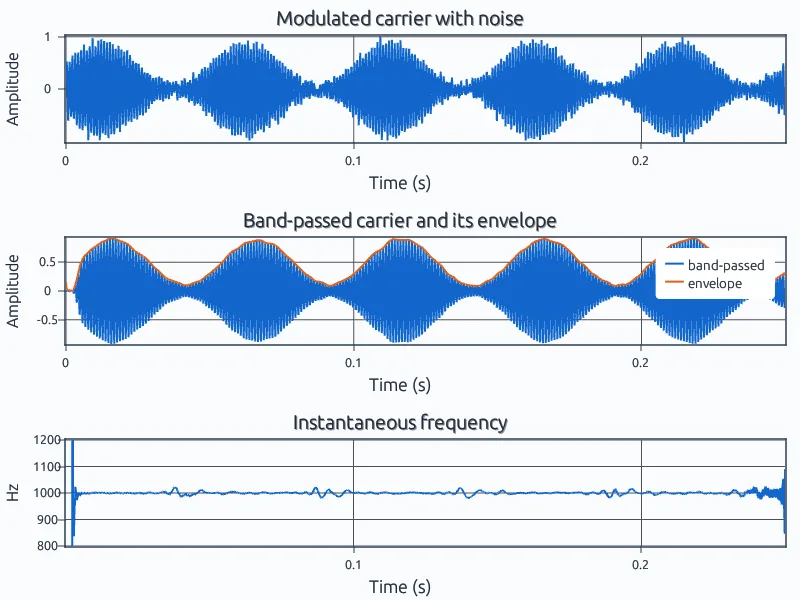
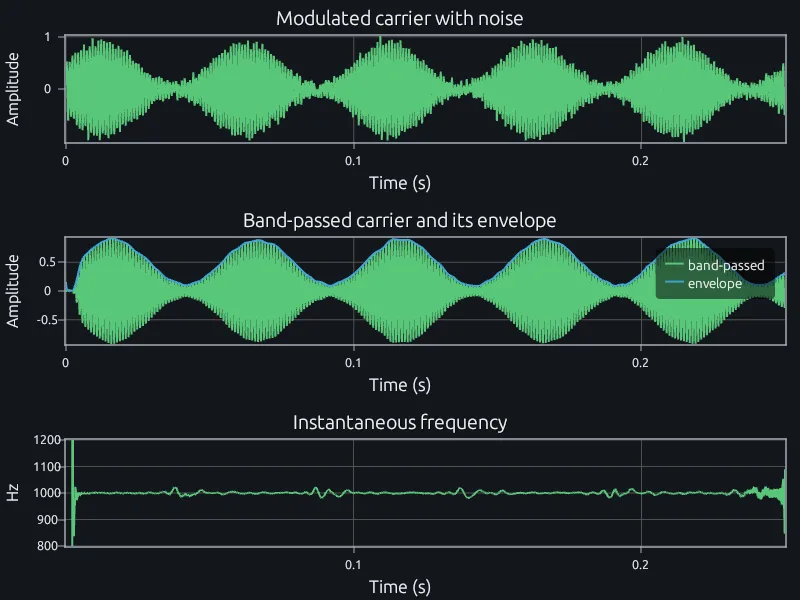
Band-pass a carrier, then read its envelope and frequency.
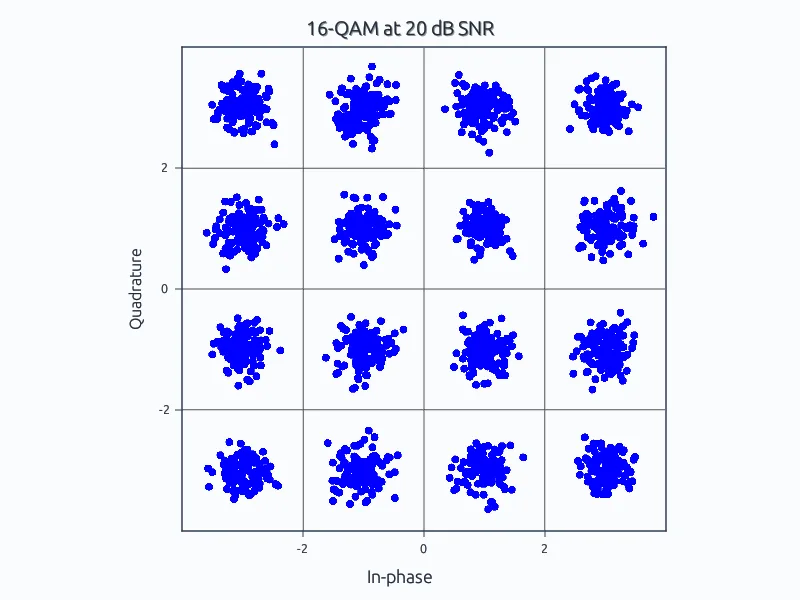
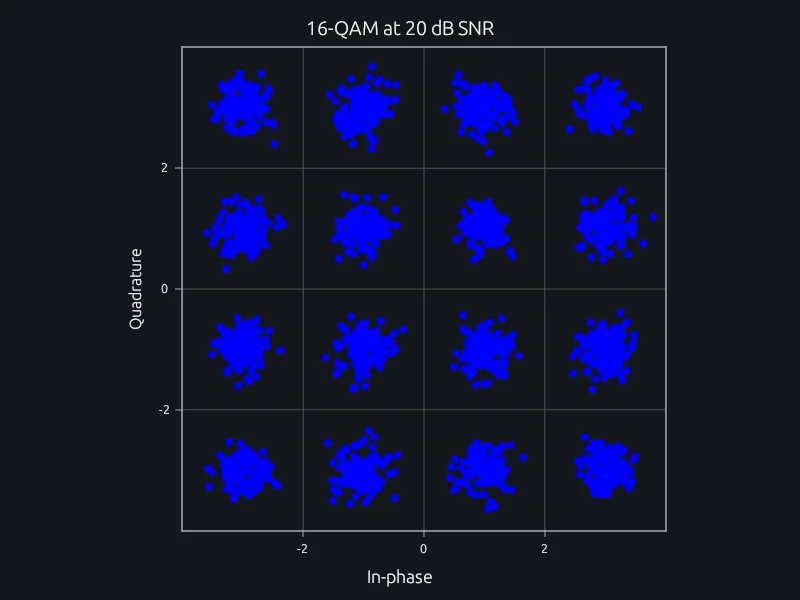
Map symbols to a constellation, add noise and plot it.