Plotting

Draw line, scatter, bar, histogram, surface and 3-D plots with plot, scatter, histogram, surf, subplot and the other plotting functions you already know.
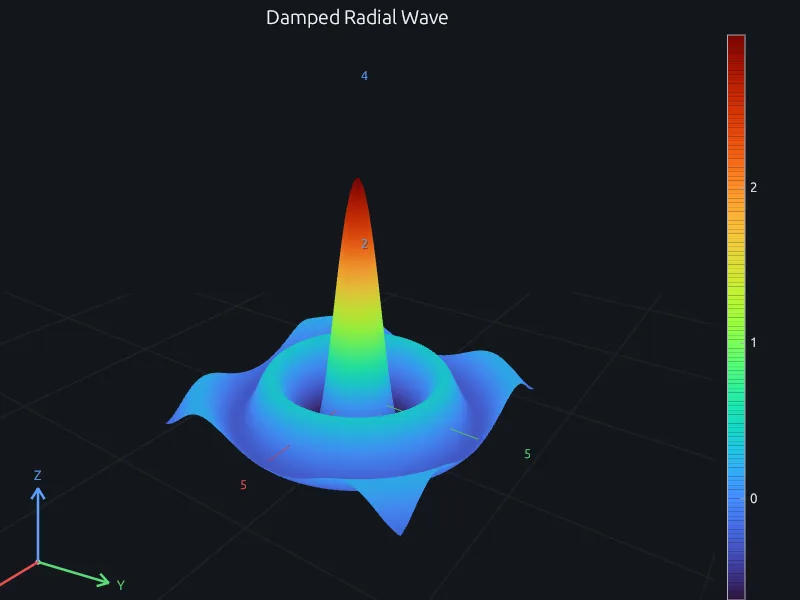
  • Existing MATLAB plotting code runs as written
  • Figures zoom, pan and rotate in the browser and on the desktop
  • Figures are drawn on the GPU, on NVIDIA, AMD, Intel and Apple hardware
  • Free to try, with nothing to install
Download RunMat

Explore the RunMat runtime

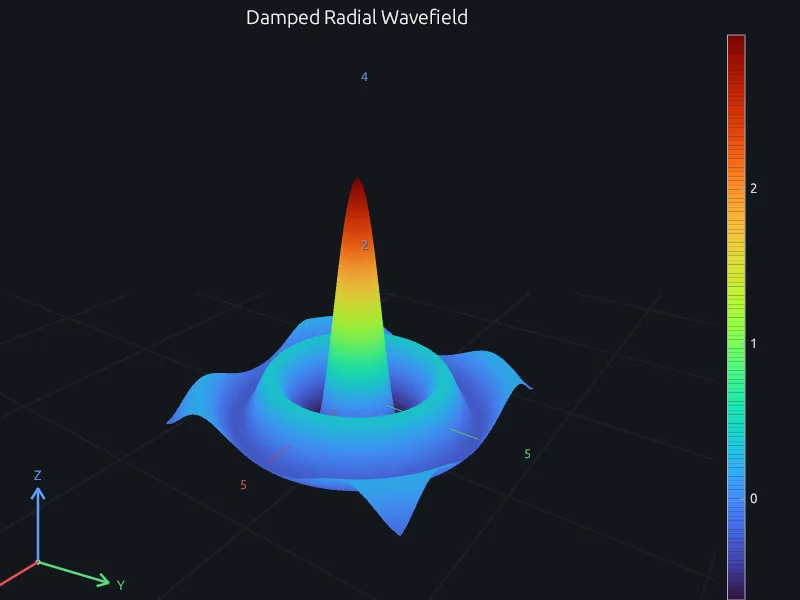
A damped radial wave drawn by RunMat as a 3-D surface from the saved analysis study
A damped radial wave from surf, drawn by RunMat. Drag to rotate it.

Why use RunMat for plotting

Free for your own figures

Figures from existing .m scripts render in the browser with nothing to install, or on the desktop with no license server to reach. The plotting functions are part of the RunMat runtime, free for individuals, education, research and smaller companies.

Runtime

Plot the full data set

Dense scatter plots and fine surfaces get sluggish to rotate, so data gets thinned out to keep the figure usable. RunMat draws on the GPU on NVIDIA, AMD, Intel and Apple hardware, so the full data set stays in the figure and stays quick to rotate.

GPU

Read a value off the plot

A saved image of a figure loses the numbers behind it. Every figure zooms, pans and rotates in the browser and the desktop app, and keeps its data so a point can be read off the plot.

Desktop app

Point at a figure together

Discussing a figure over a screenshot means describing which peak or curve is meant. Open the figure with a colleague and each person sees the other's pointer inside the plot, on the same view.

Collaboration

Plot gallery

Lines and points

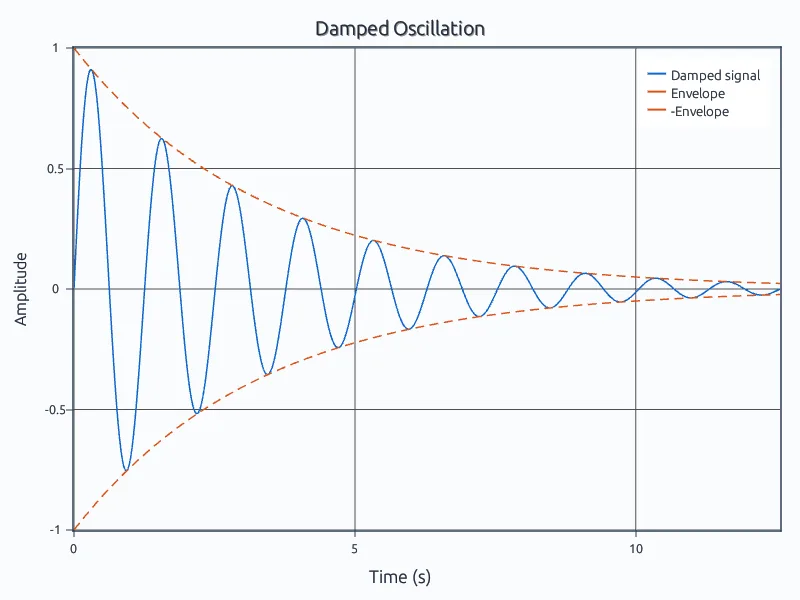
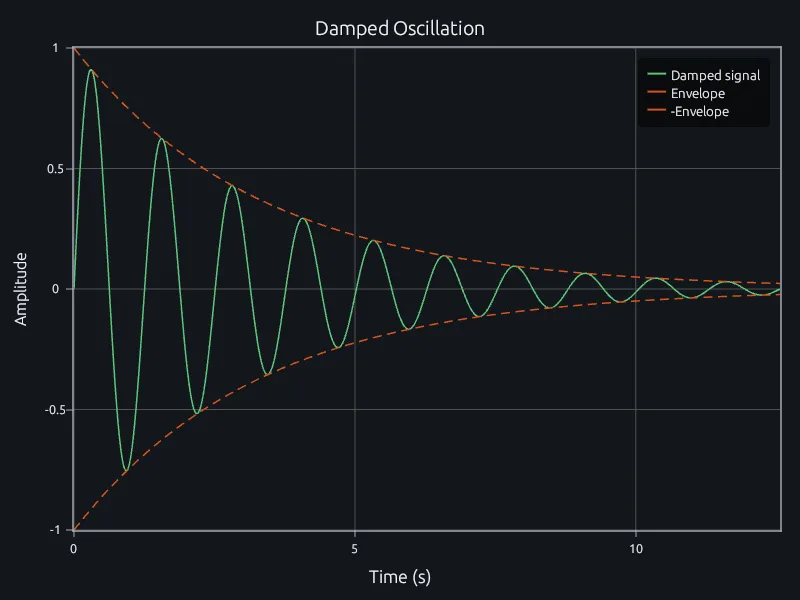
A damped sine wave between its two dashed envelopes, rendered by RunMat

Line plot

A damped oscillation and its envelope with plot and hold on.
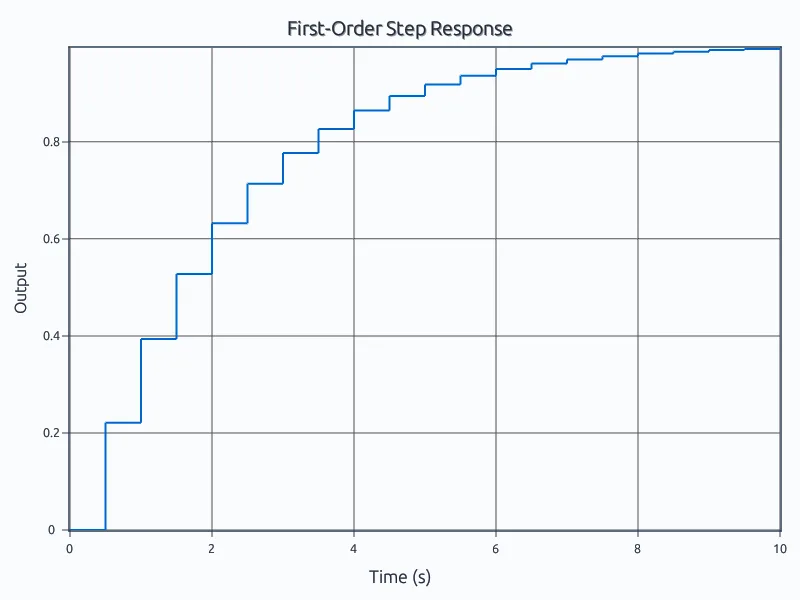
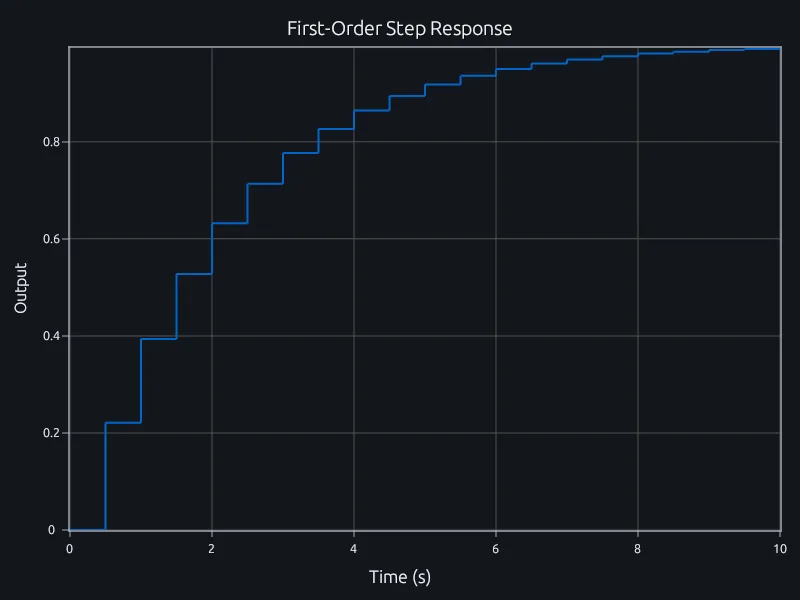
A first-order step response drawn as steps, rendered by RunMat

Stairstep plot

A sampled step response held between samples.
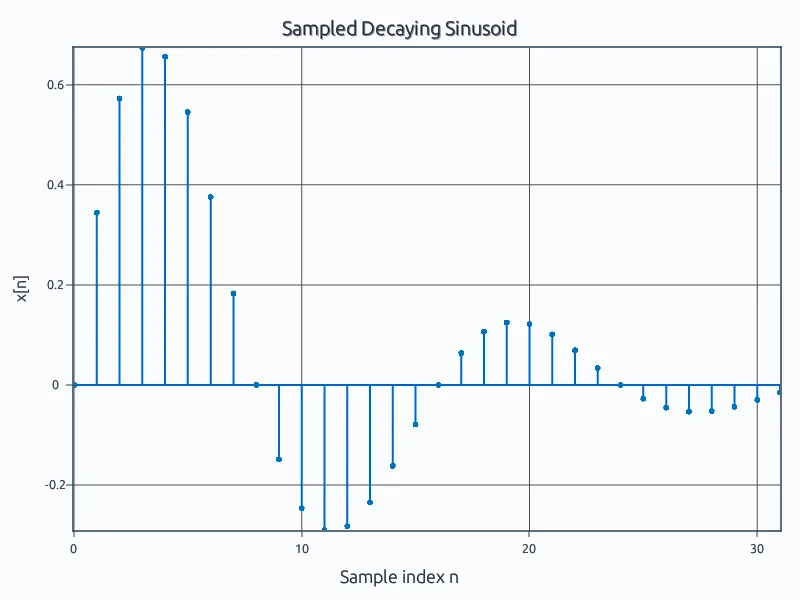
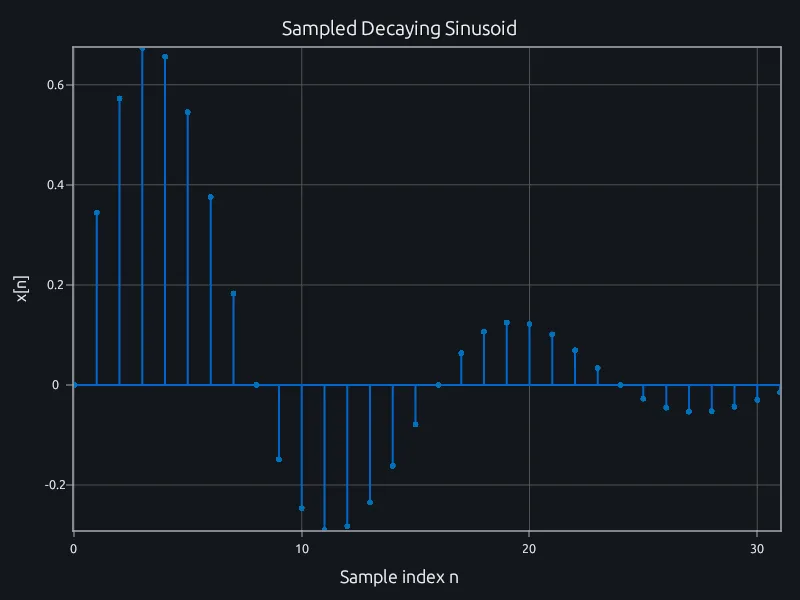
Stems for the samples of a decaying sinusoid, rendered by RunMat

Stem plot

Discrete samples of a decaying sinusoid.
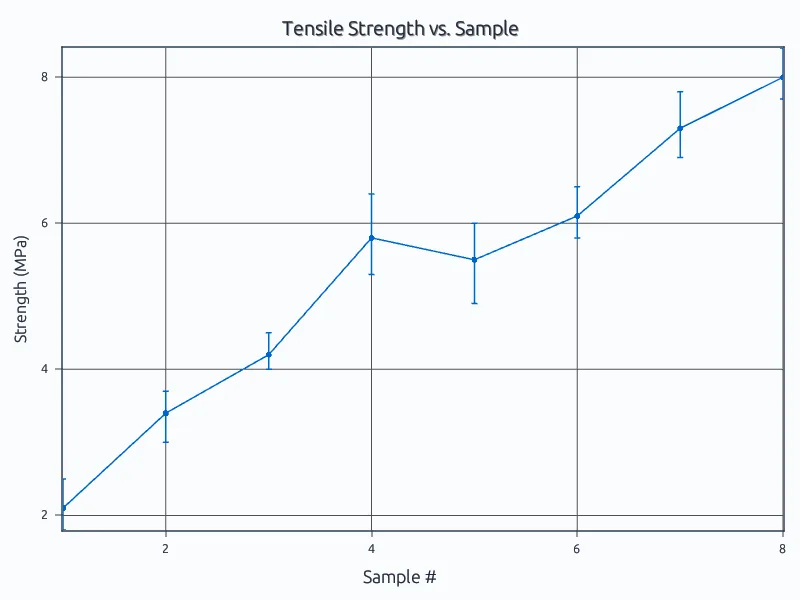
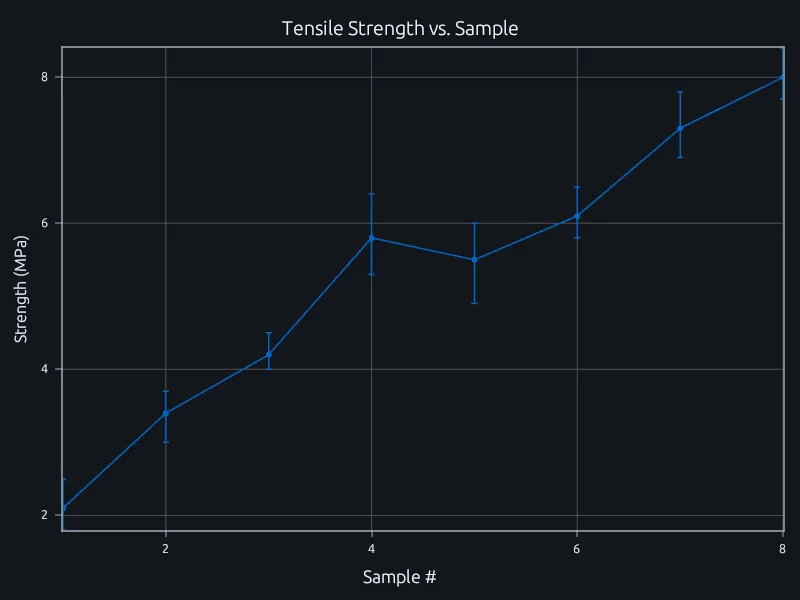
Strength for eight samples joined by a line, with error bars, rendered by RunMat

Error bars

Measured strength with asymmetric error bars.
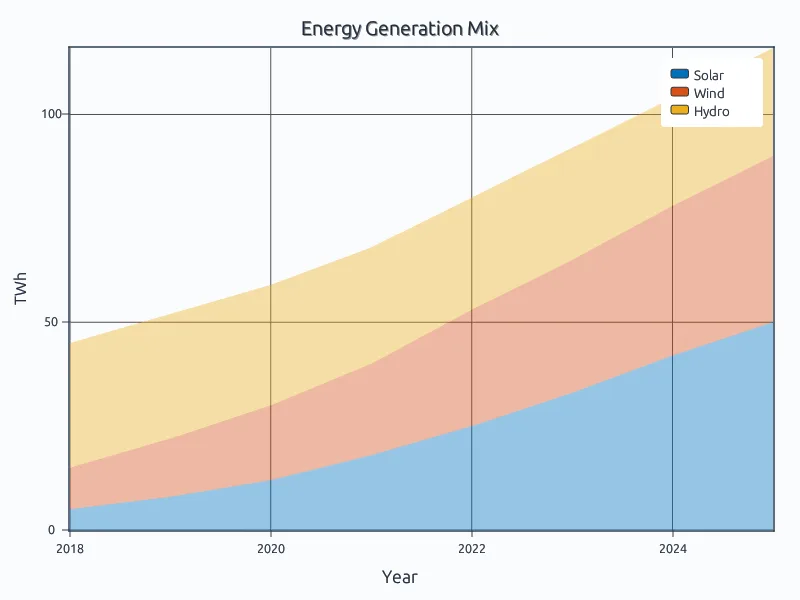
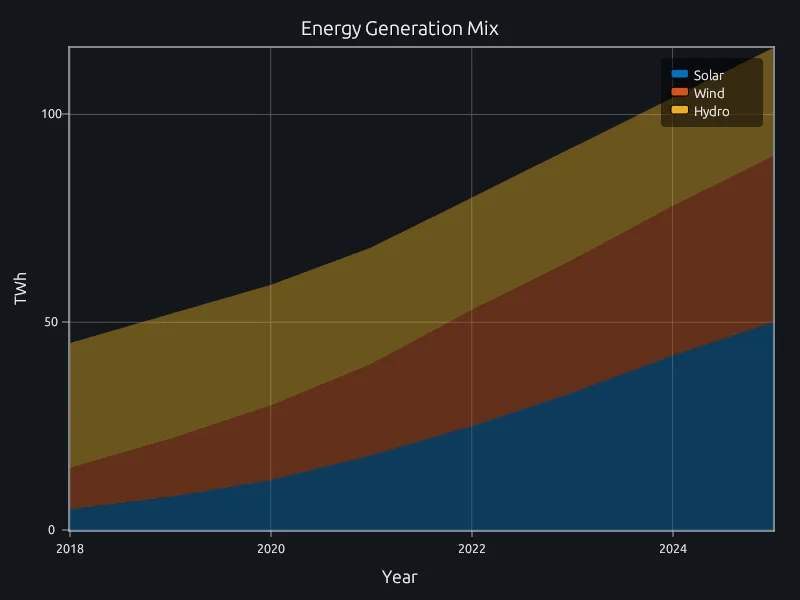
Solar, wind and hydro generation stacked from 2018 to 2025, rendered by RunMat

Stacked area

Energy generation by source, stacked by year.
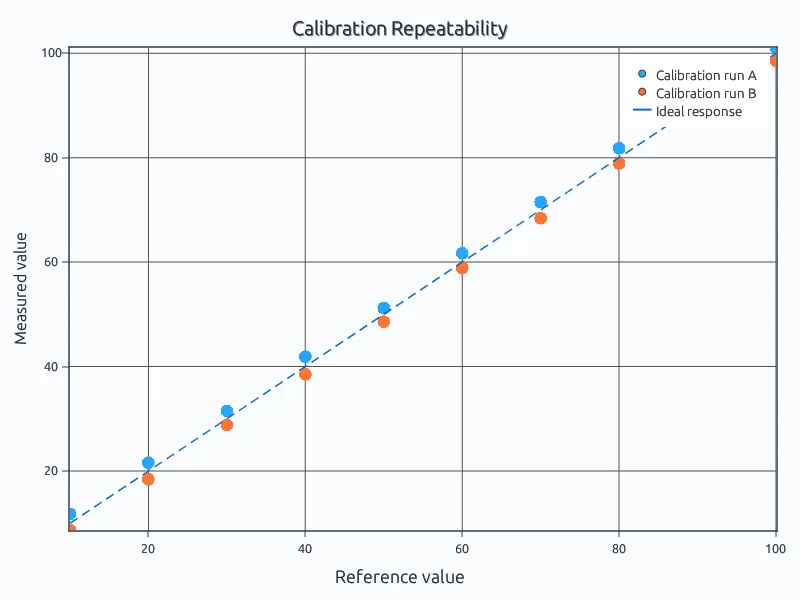
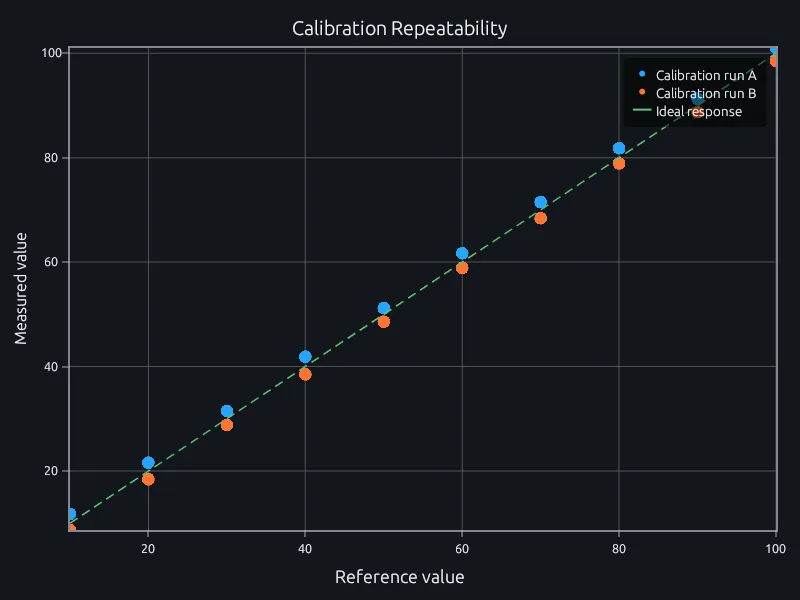
Two sets of calibration points either side of a dashed ideal line, rendered by RunMat

Scatter plot

Two calibration runs against the ideal line.
Compare and distribute

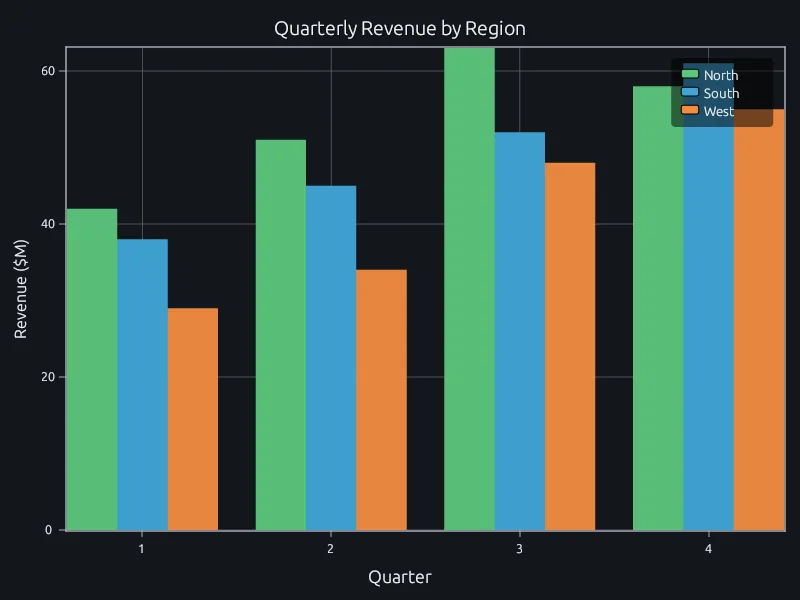
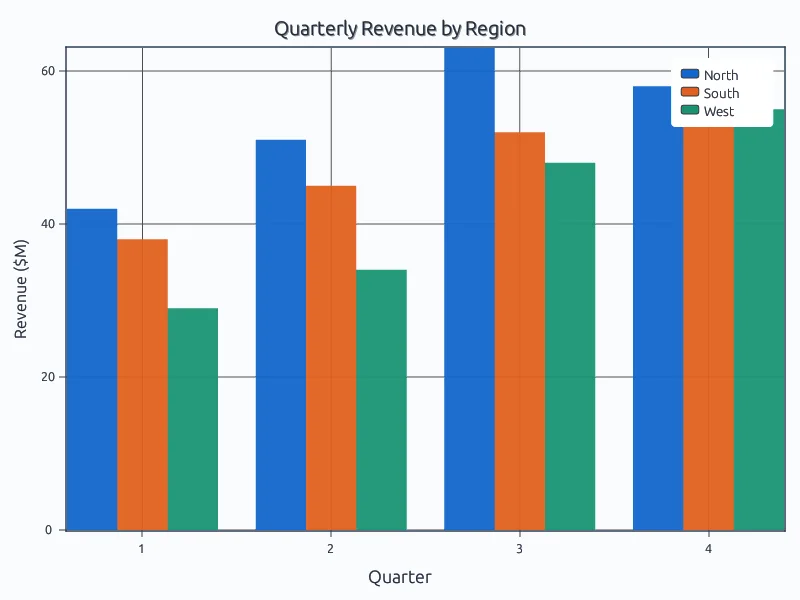
Grouped bars of revenue for three regions over four quarters, rendered by RunMat

Grouped bar chart

Quarterly revenue for three regions, side by side.
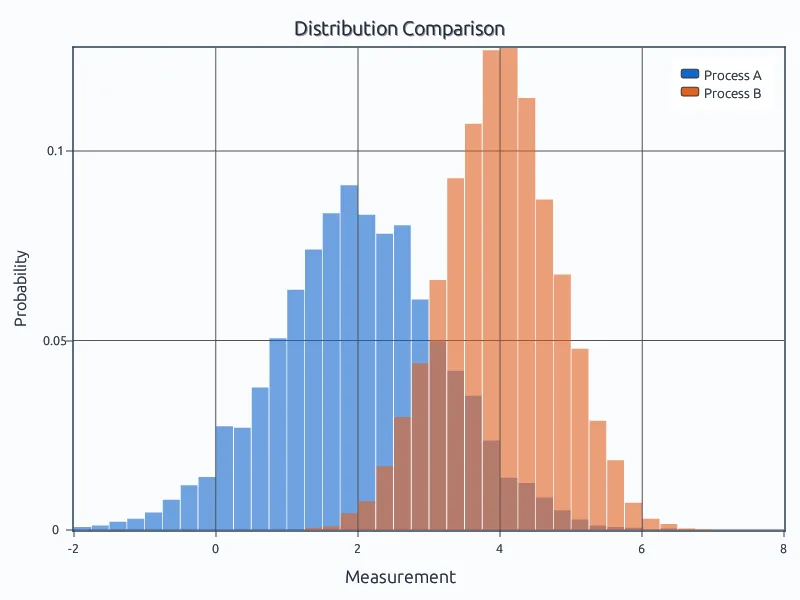
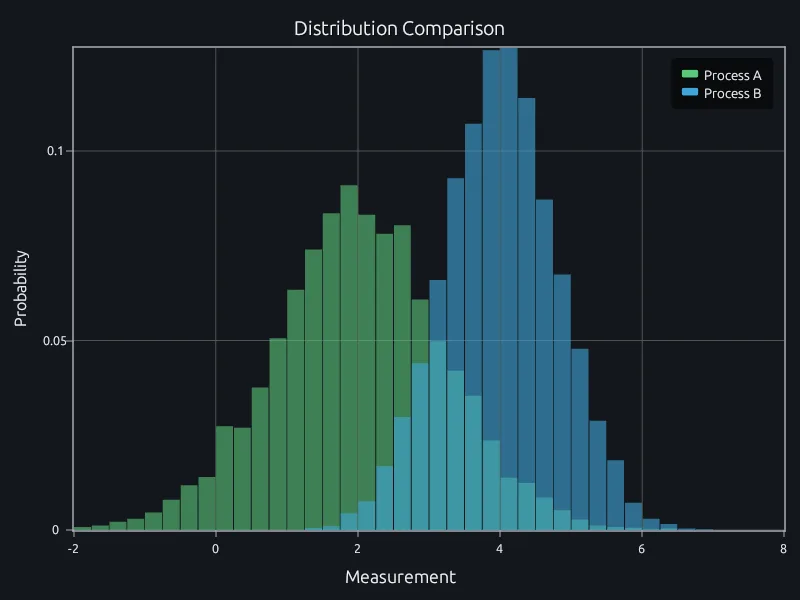
Two overlapping histograms with transparent bars, rendered by RunMat

Overlaid histograms

Two distributions with shared bin edges.
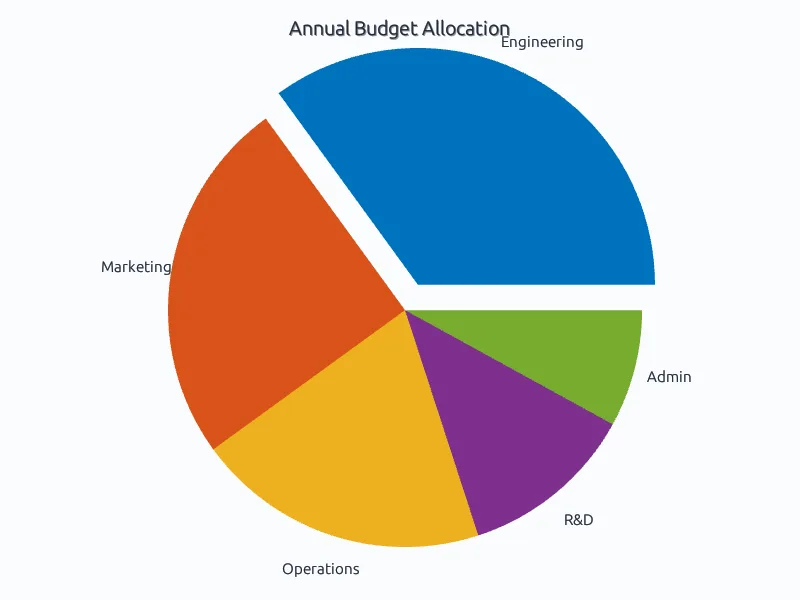
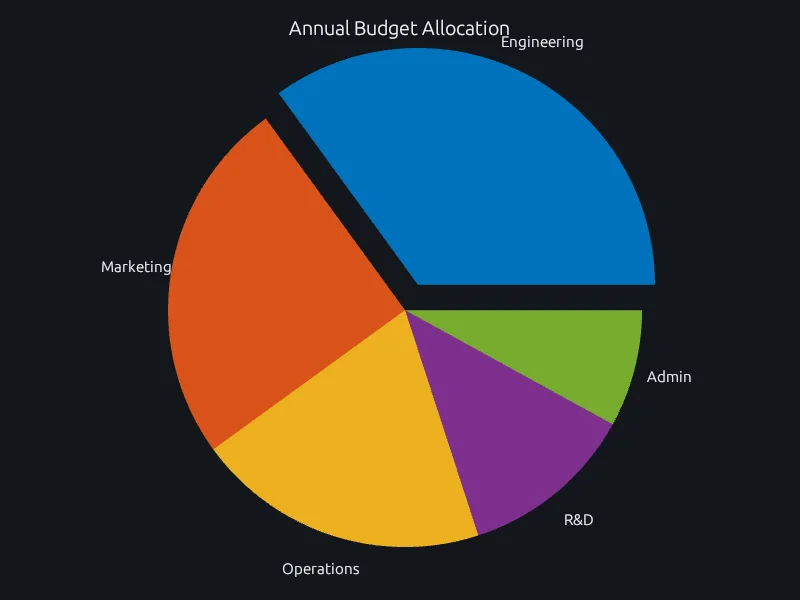
A five-slice pie chart with the largest slice pulled out, rendered by RunMat

Pie chart

Budget shares with one slice pulled out.
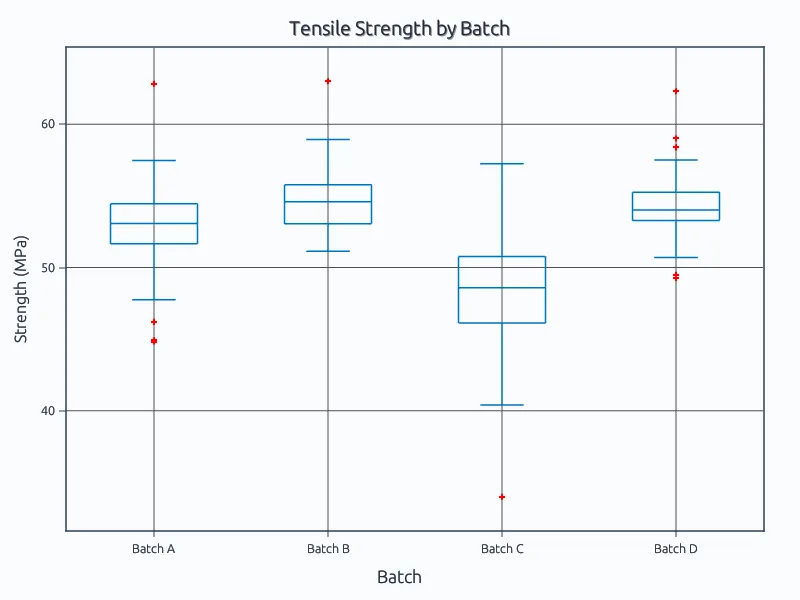
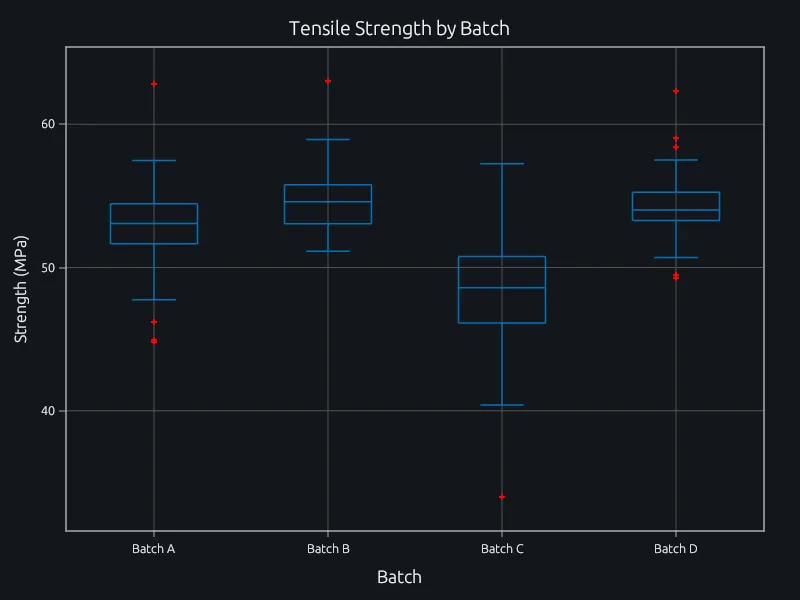
Box plots of tensile strength for four batches with outliers marked, rendered by RunMat

Box plot

Spread and outliers of four production batches.
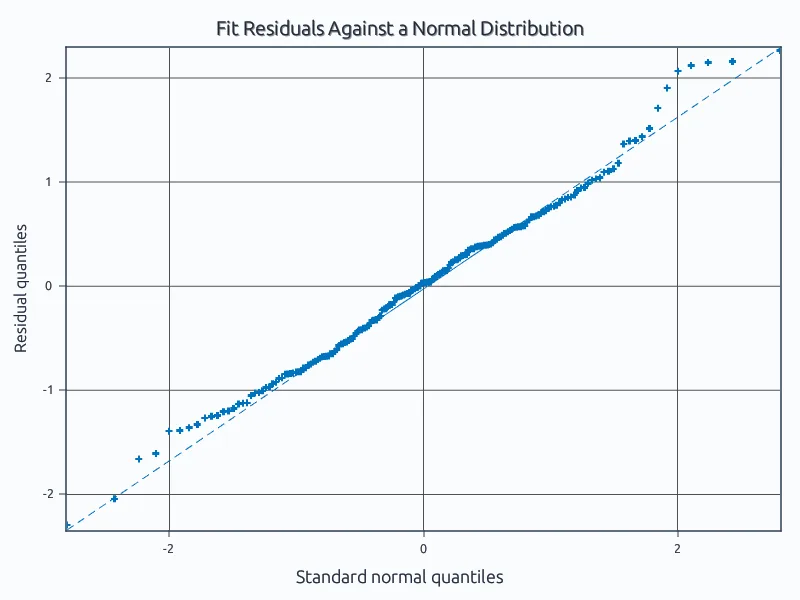
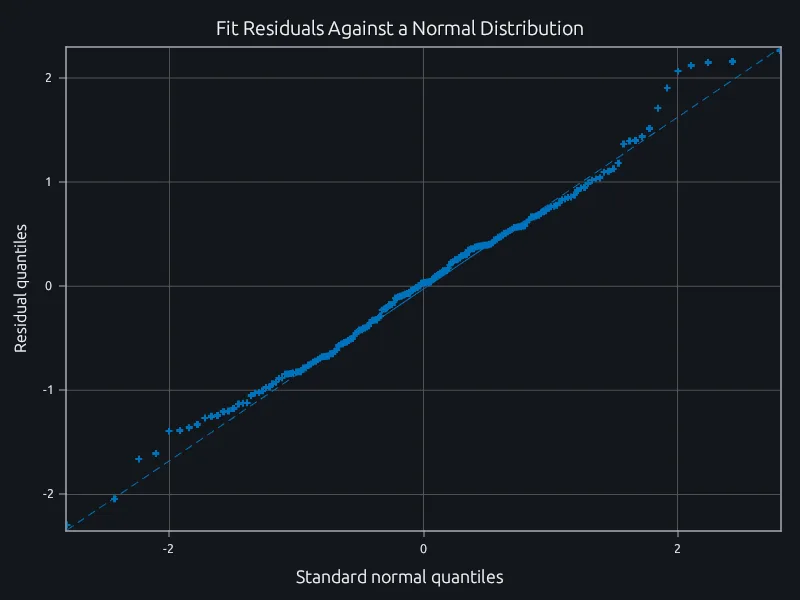
Residual quantiles against normal quantiles along a reference line, rendered by RunMat

Quantile-quantile plot

Fit residuals against a normal distribution.
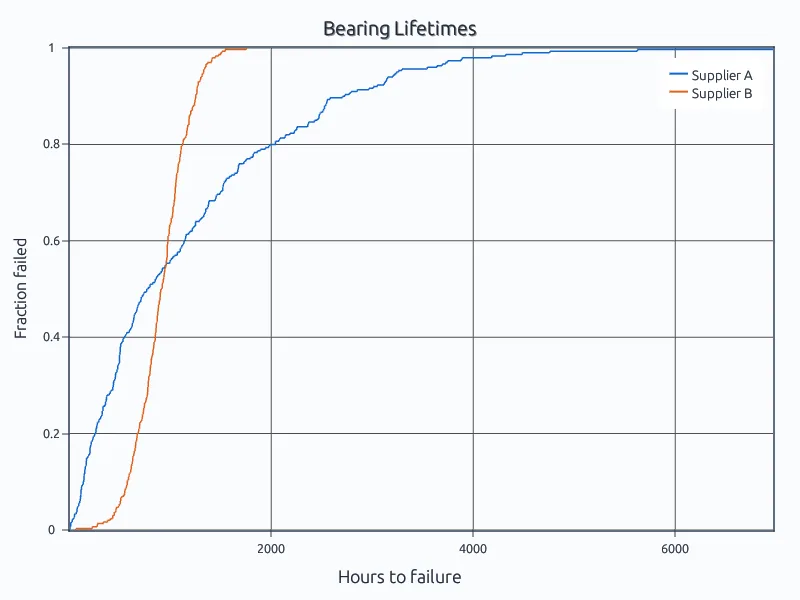
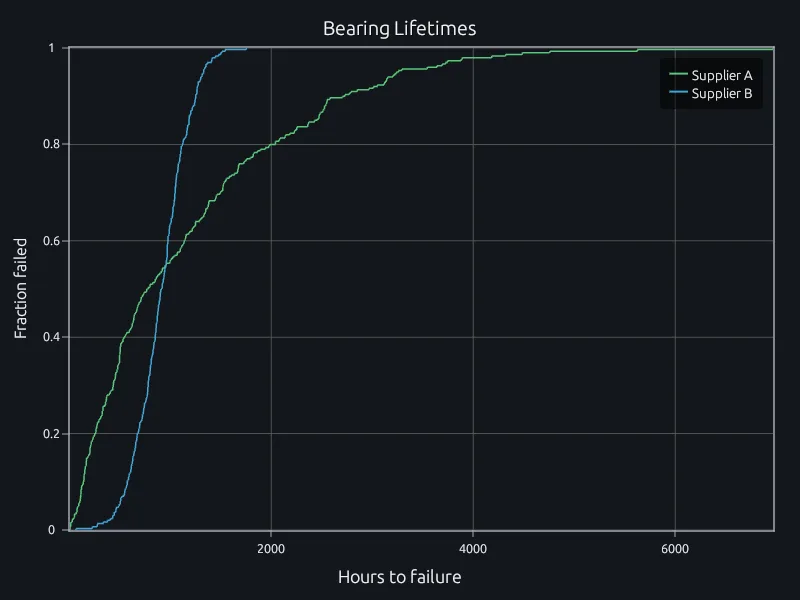
Two empirical cumulative distribution curves of lifetimes, rendered by RunMat

Empirical CDF

Bearing lifetimes from two suppliers.
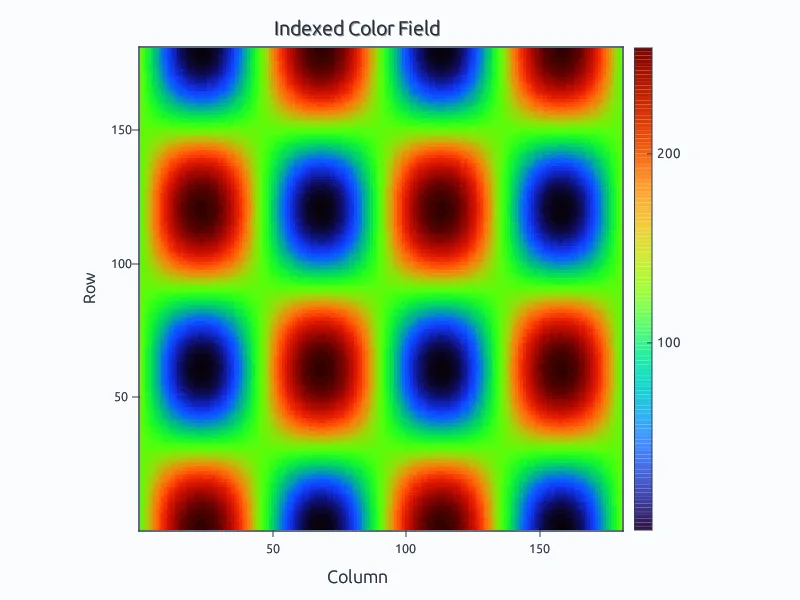
Images and fields

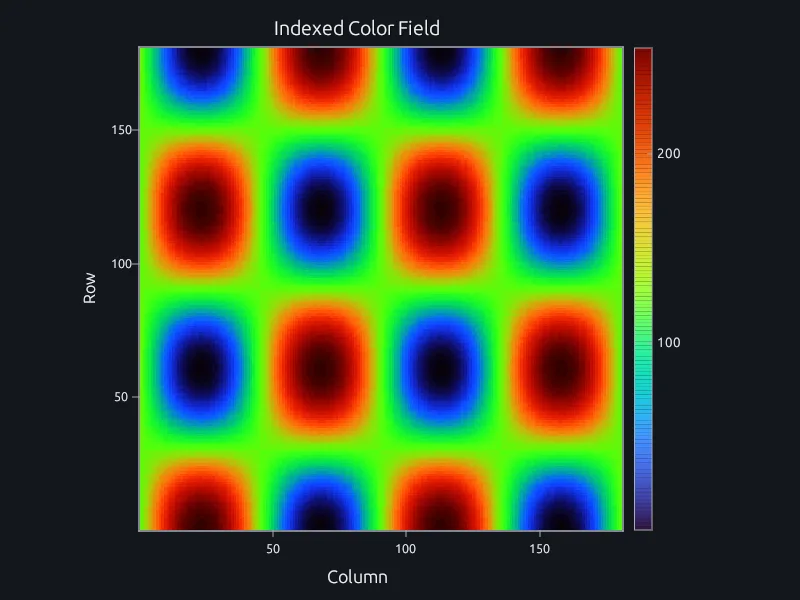
A grid of colored blobs from an indexed image, rendered by RunMat

Indexed image

A matrix of colormap indices shown with image.
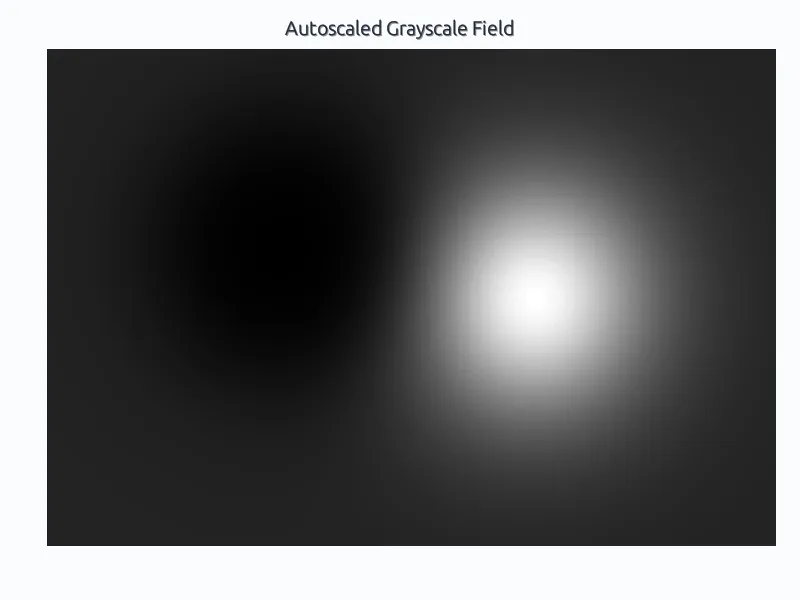
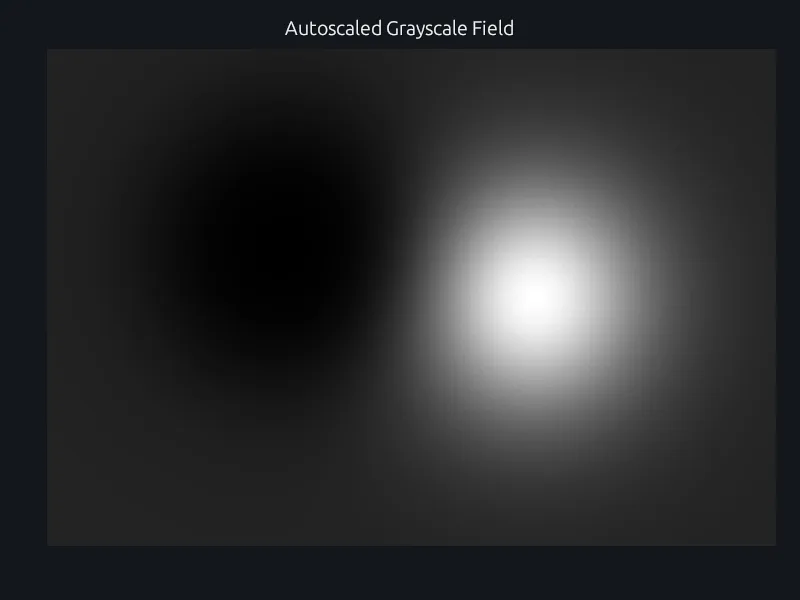
A grayscale field with one dark and one bright spot, rendered by RunMat

Grayscale image

A field scaled to its own range with imshow(X, []).
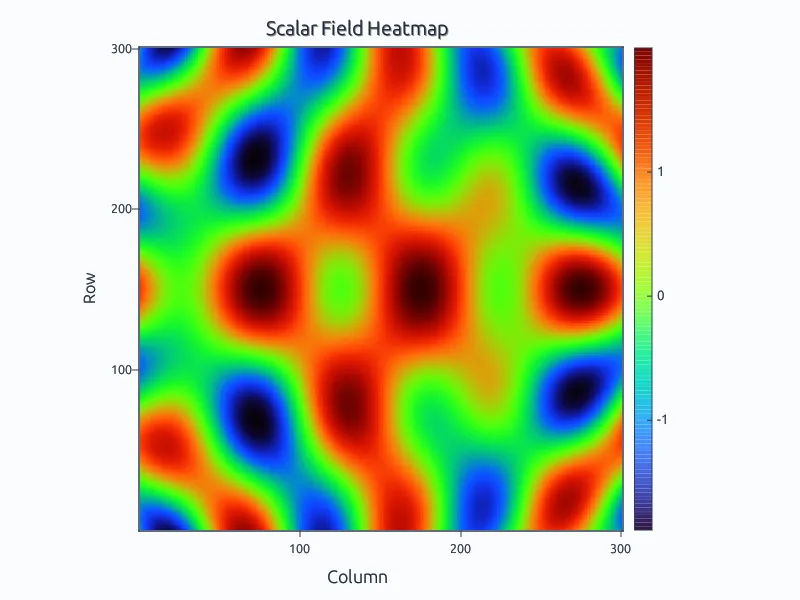
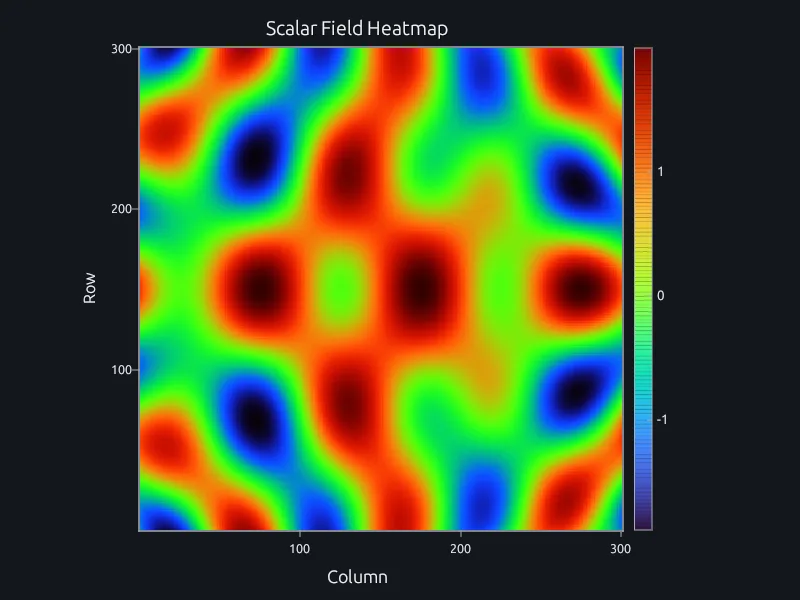
A scalar field drawn with imagesc and a colorbar, rendered by RunMat

Scaled image

A scalar field shown with its colorbar.
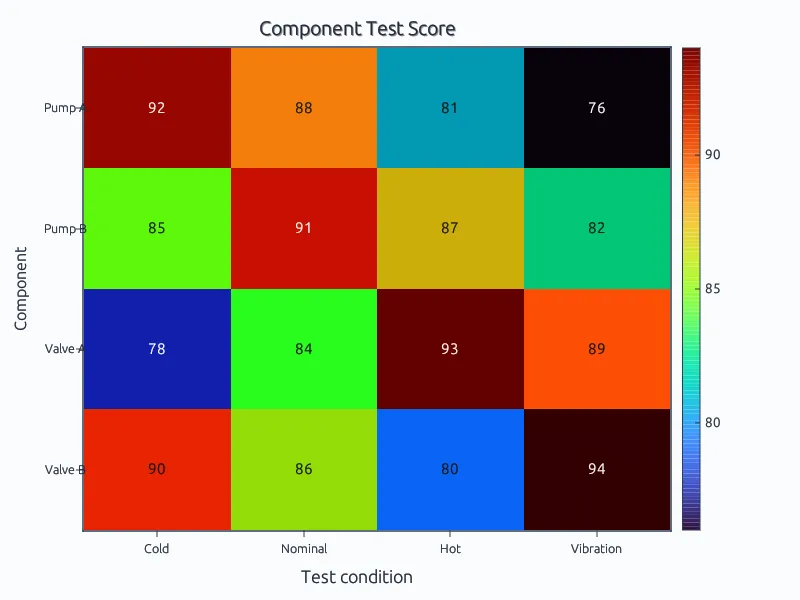
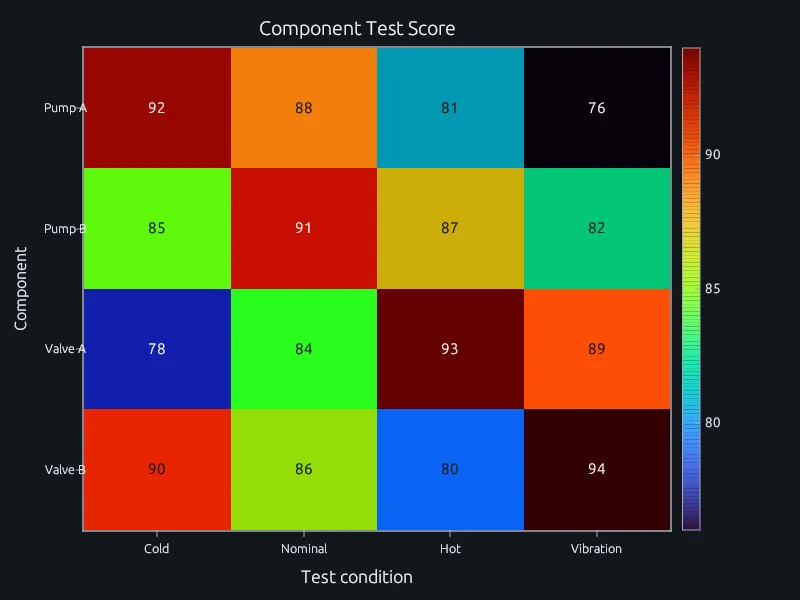
A four by four heatmap of test scores with the values printed in each cell, rendered by RunMat

Heatmap

Test scores by component and condition, with each value in its cell.
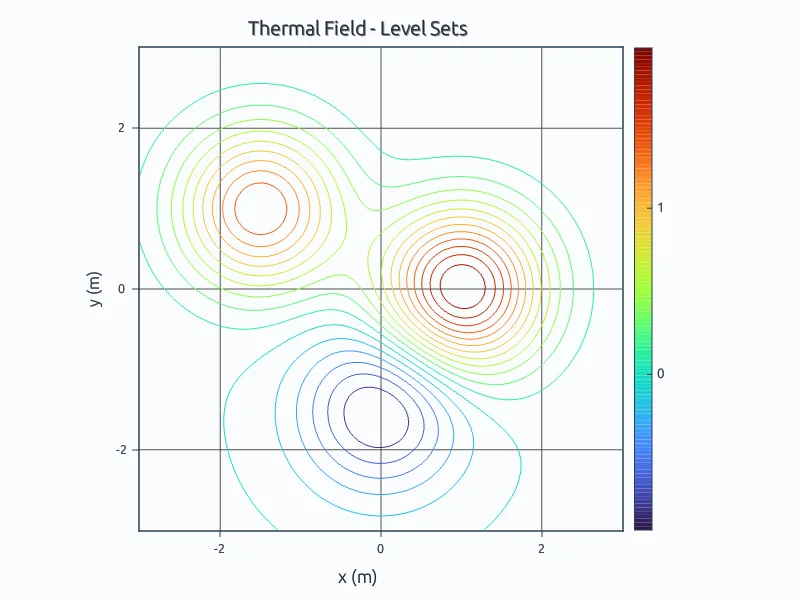
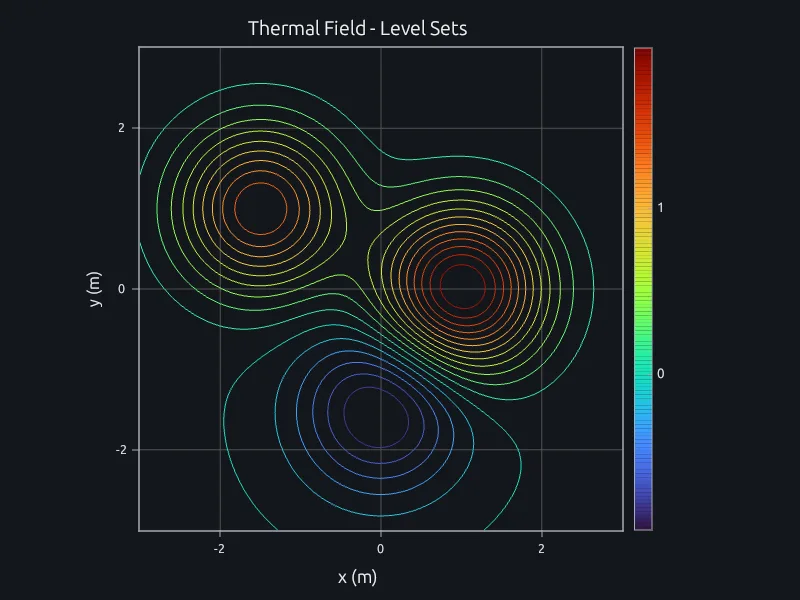
Contour lines around two peaks and a trough, rendered by RunMat

Contour lines

Level sets of a thermal field.

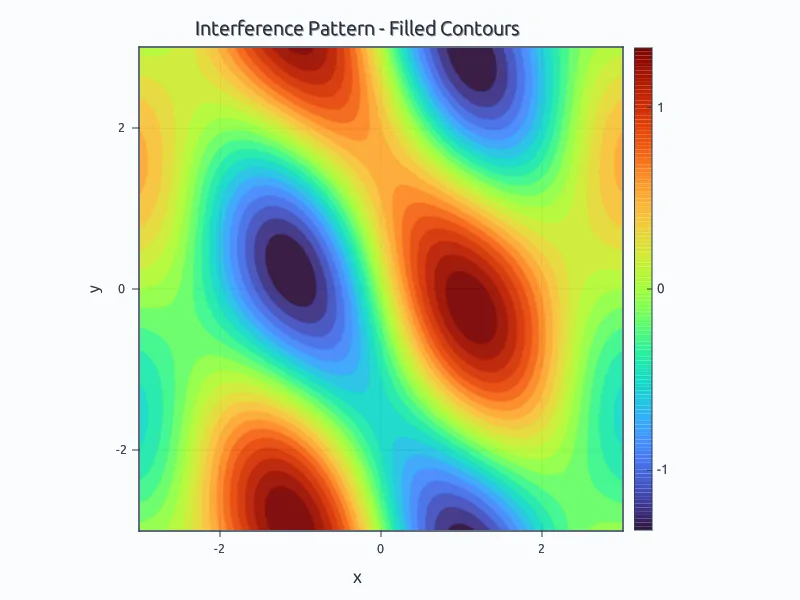
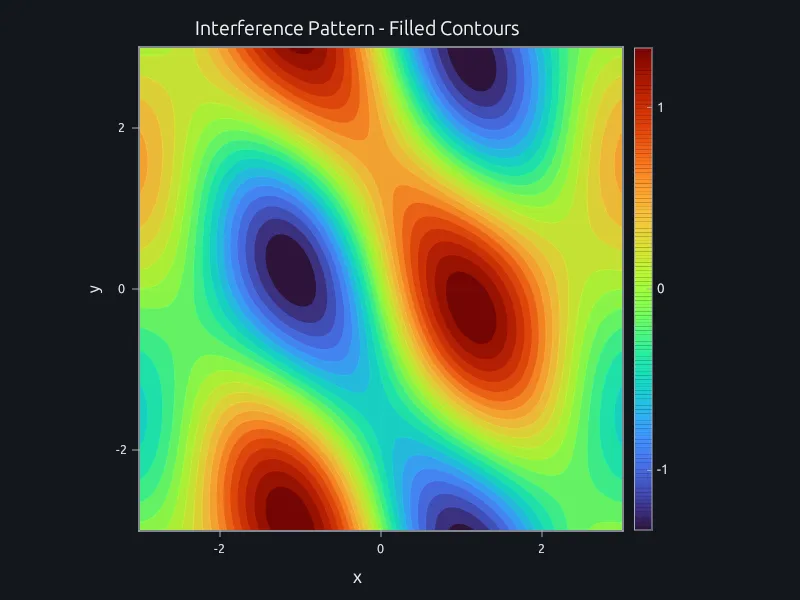
Filled contour bands of an interference pattern, rendered by RunMat

Filled contours

An interference pattern in filled bands.
Surfaces and 3-D

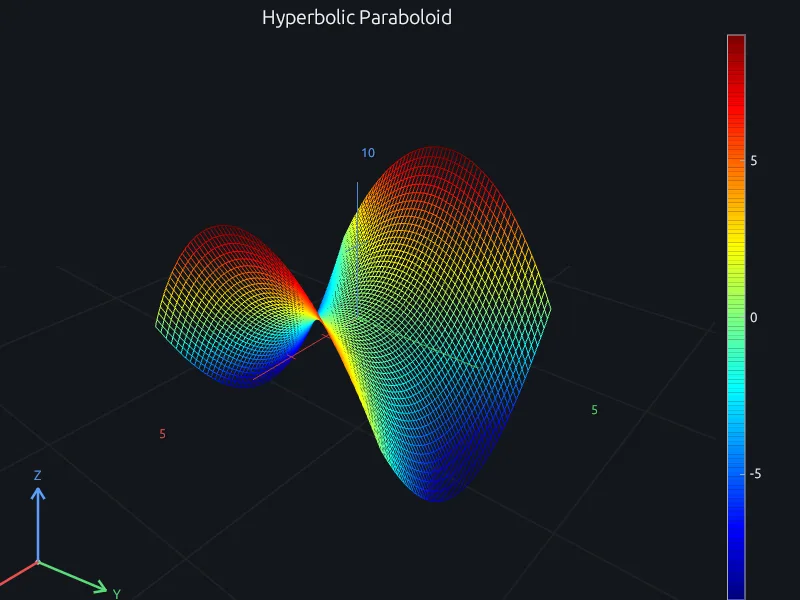
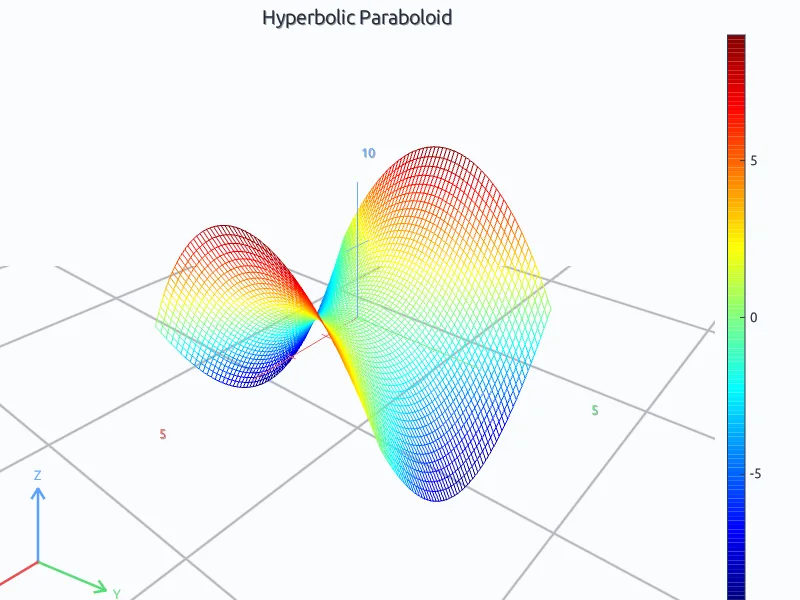
A saddle-shaped wireframe surface, rendered by RunMat

Mesh

A saddle surface drawn as a wireframe.
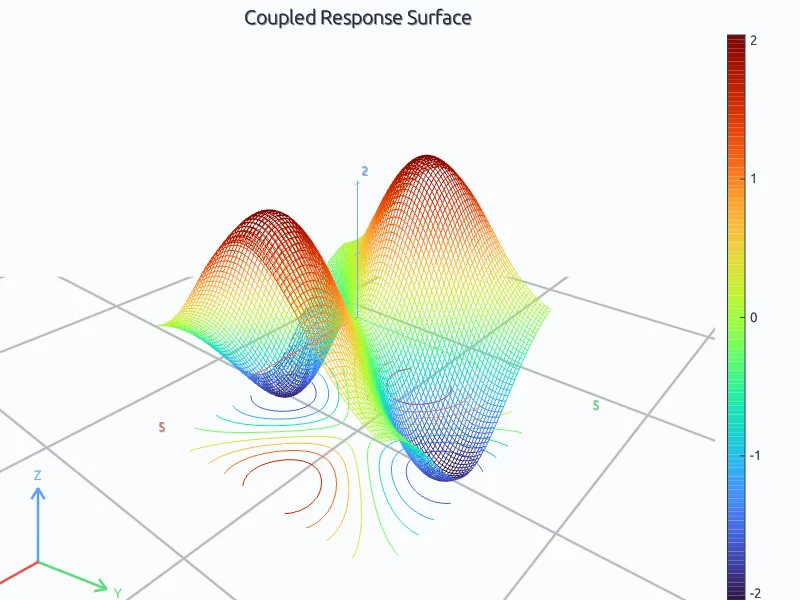
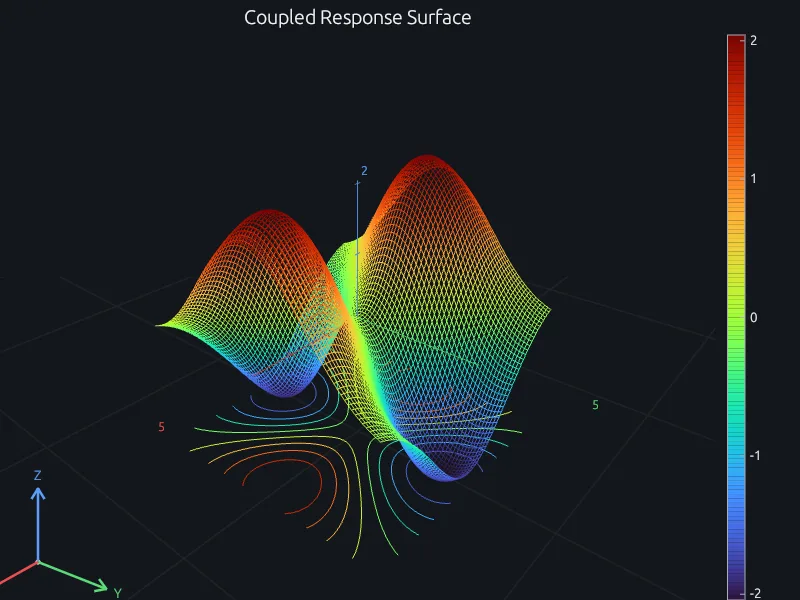
A wireframe surface with contour lines drawn beneath, rendered by RunMat

Mesh with contours

A wireframe with its contour map below it.
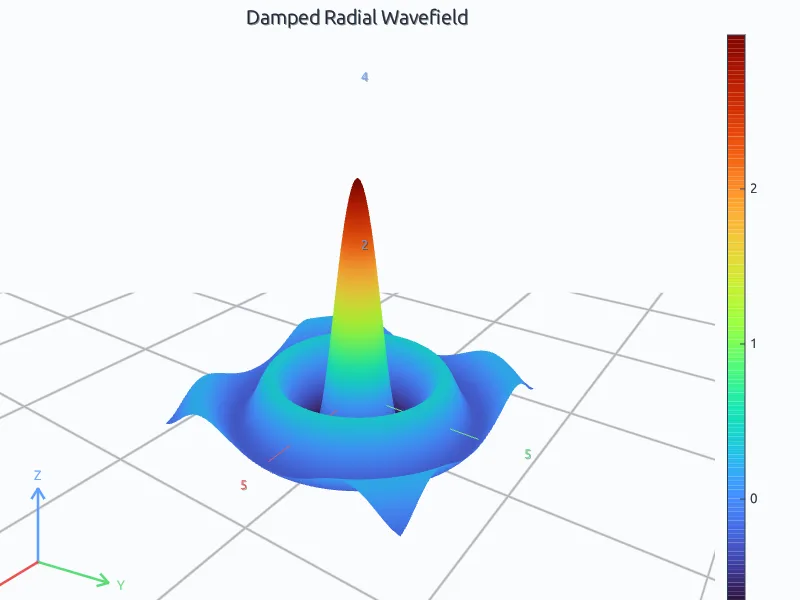
A damped radial wave surface, rendered by RunMat

Surface

A damped radial wave with interpolated shading.
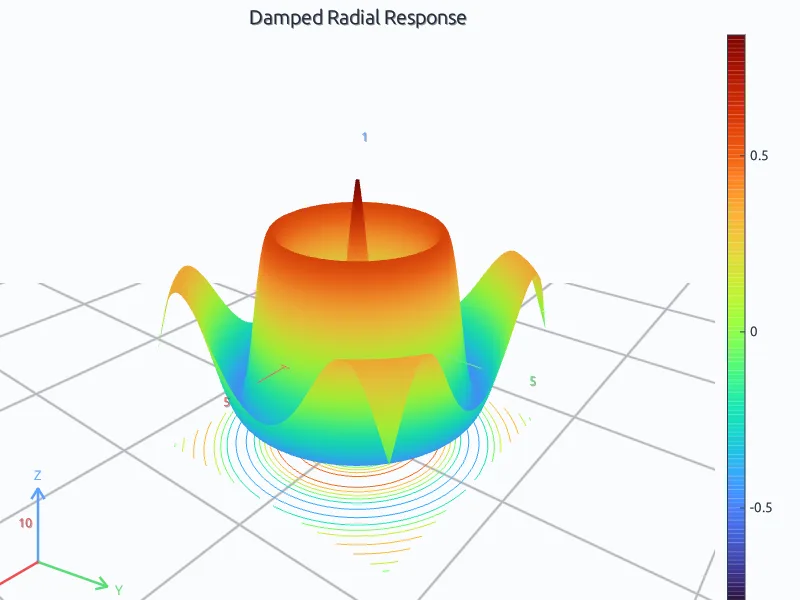
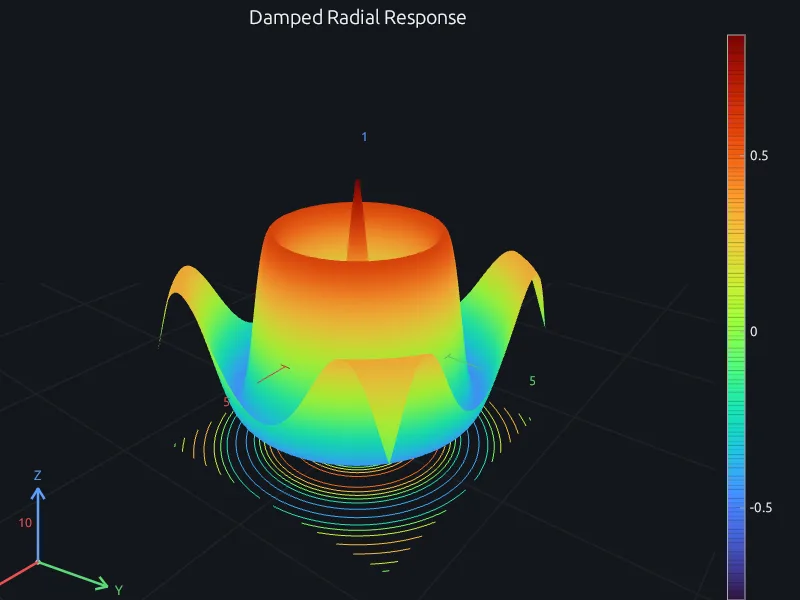
A rippled surface with contour rings drawn beneath, rendered by RunMat

Surface with contours

A surface with its contour map below it.
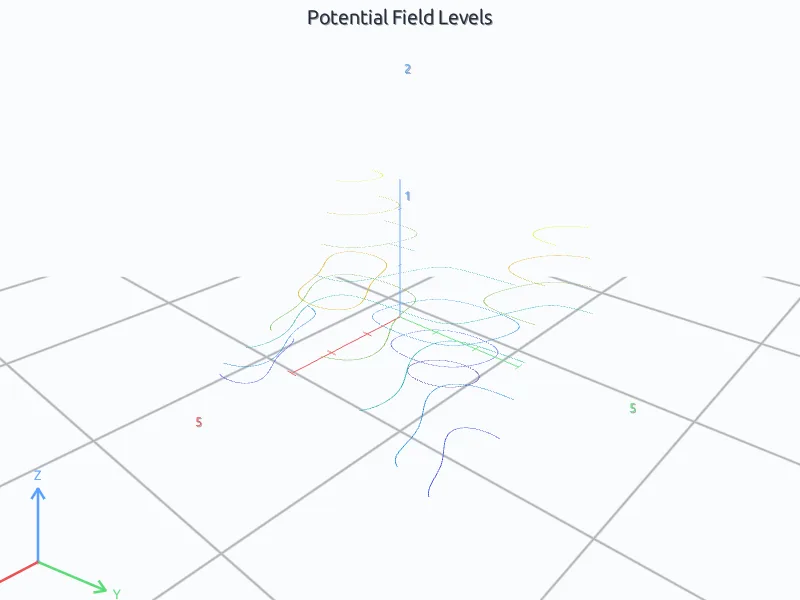
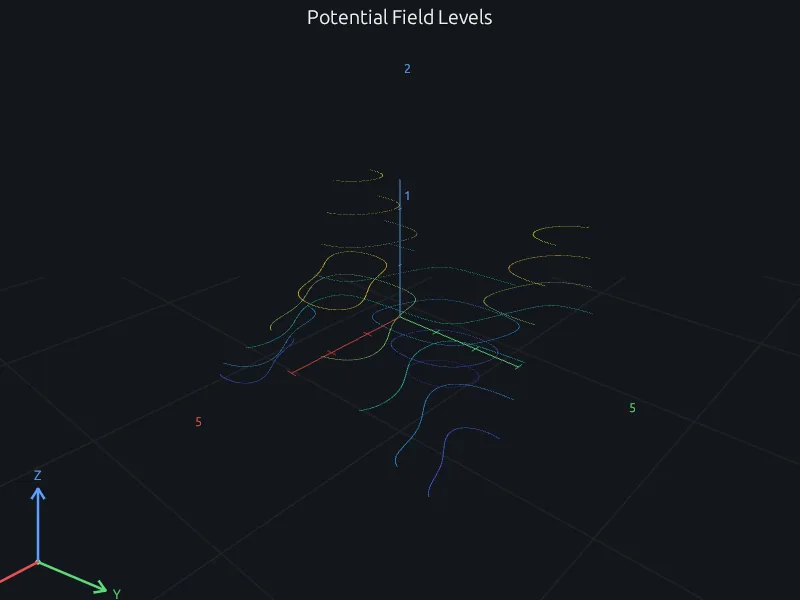
Contour lines of a field drawn in 3-D, rendered by RunMat

3-D contours

Contour lines drawn at their own heights.
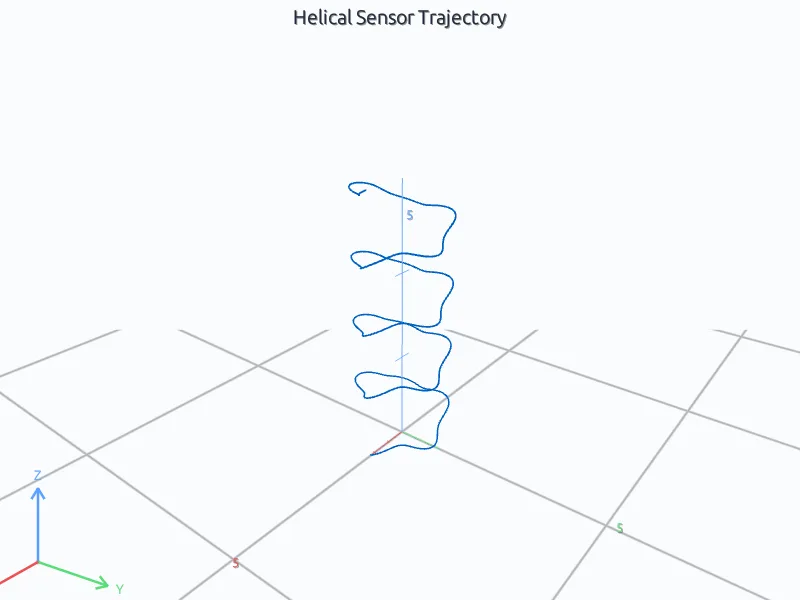
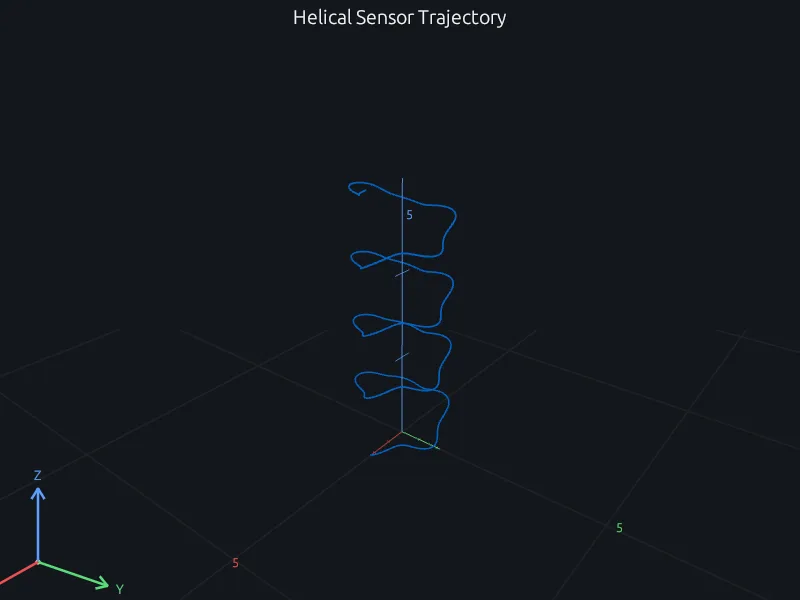
A helical line rising through 3-D space, rendered by RunMat

3-D line

A helical sensor trajectory.

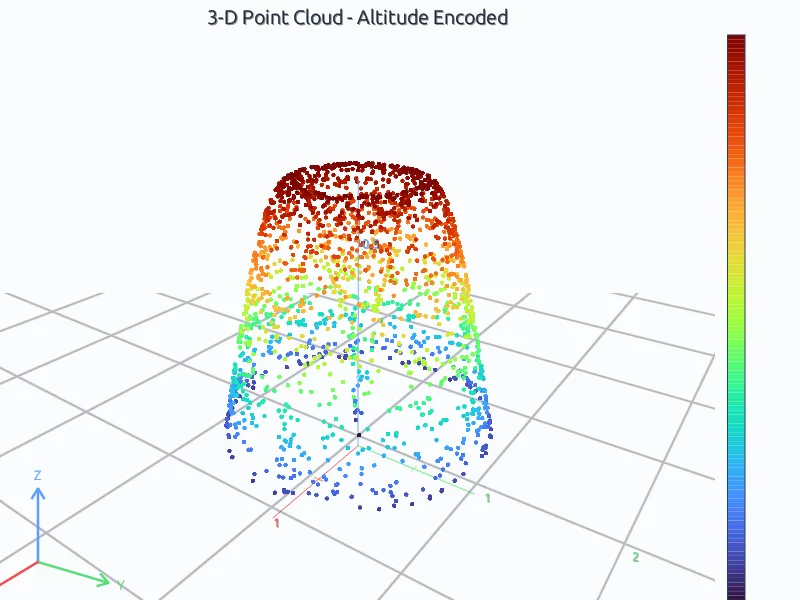
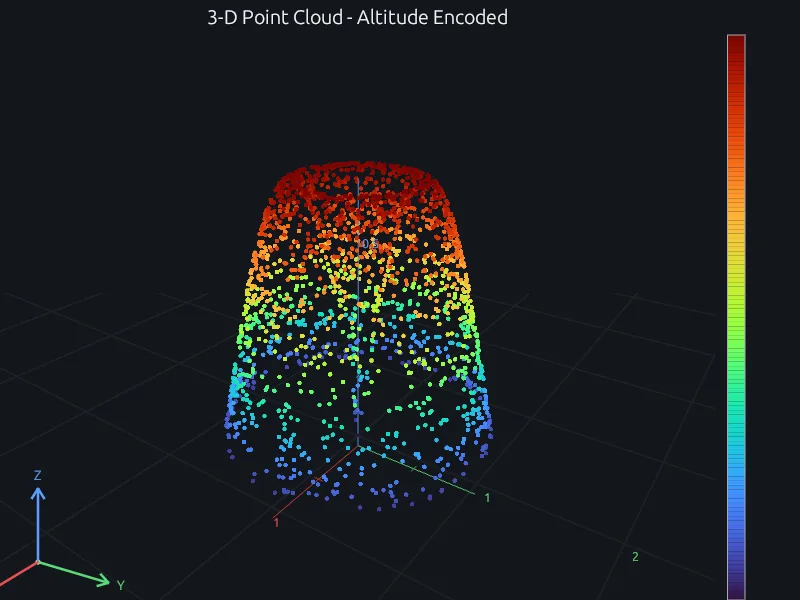
A dome of points colored from blue at the bottom to red at the top, rendered by RunMat

3-D scatter

Two thousand points colored by height.
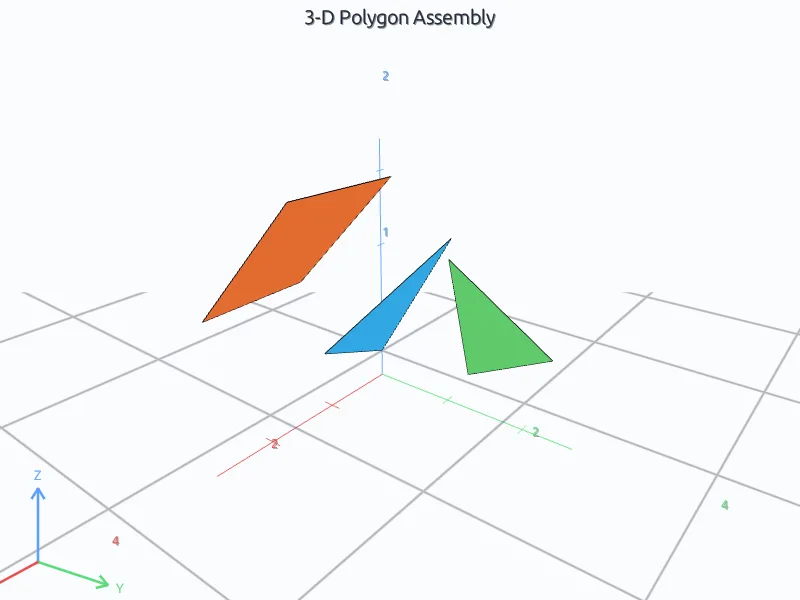
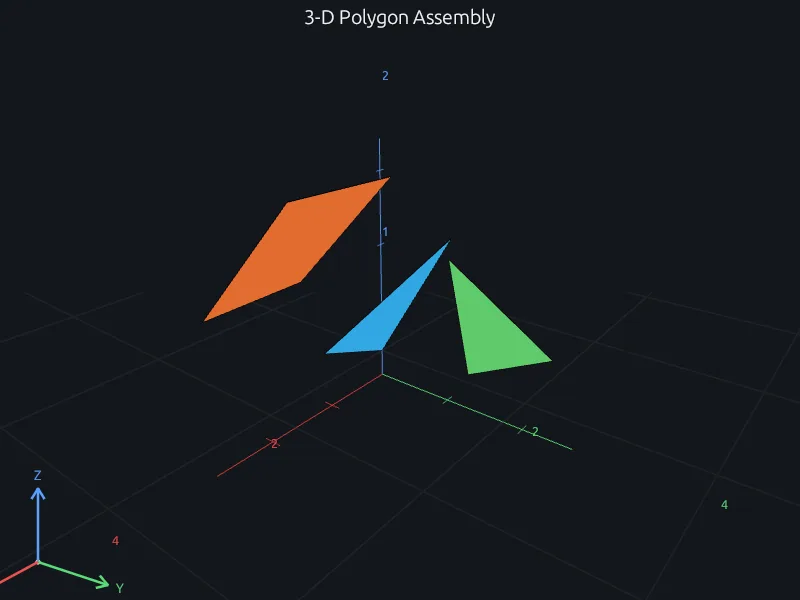
Three filled polygons floating in 3-D, rendered by RunMat

3-D polygons

Filled polygons placed in space.

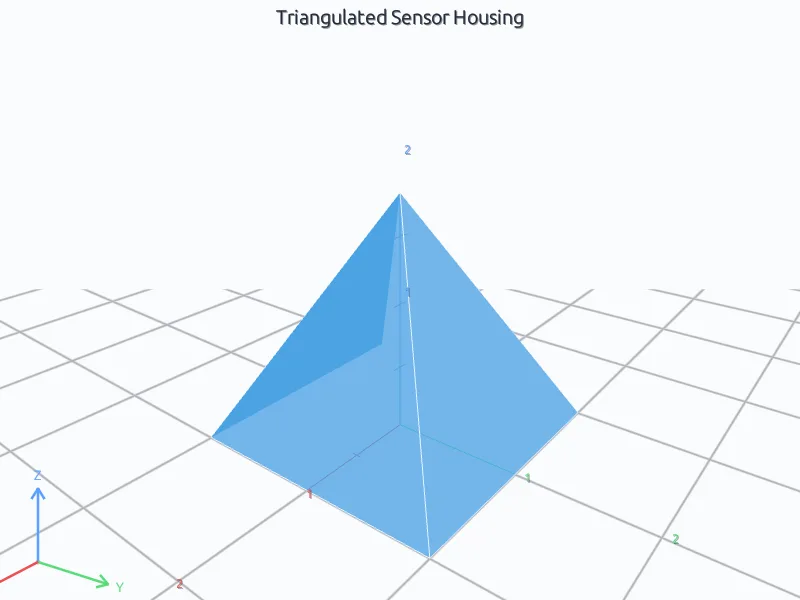
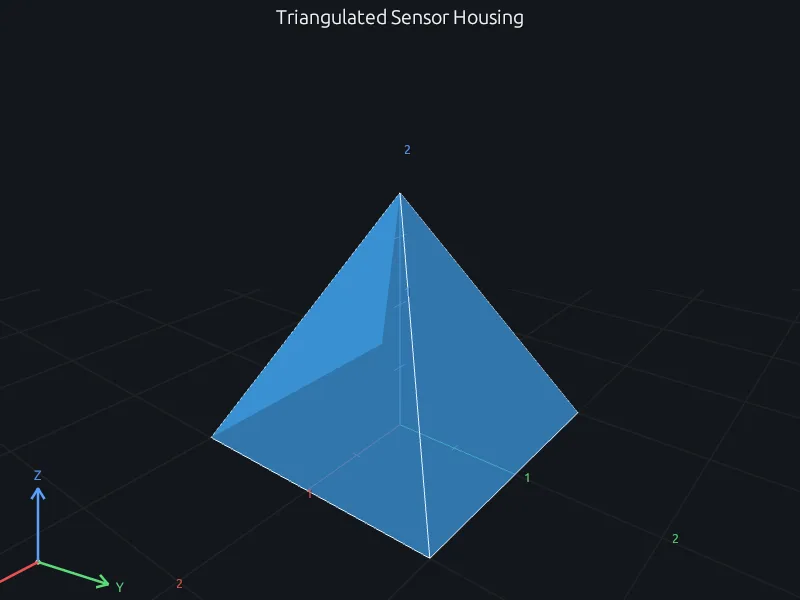
A translucent pyramid built with patch, rendered by RunMat

Patch

A pyramid from a face and vertex list.
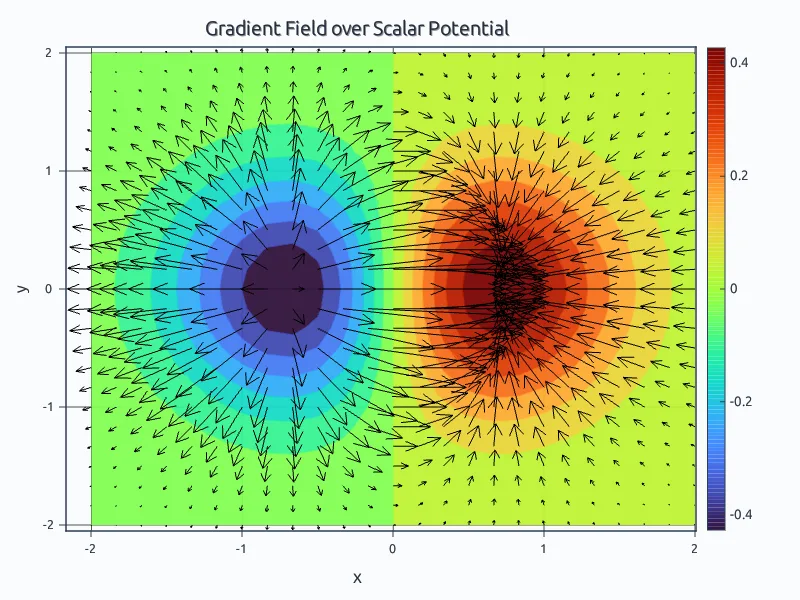
Vectors, polar and log scales

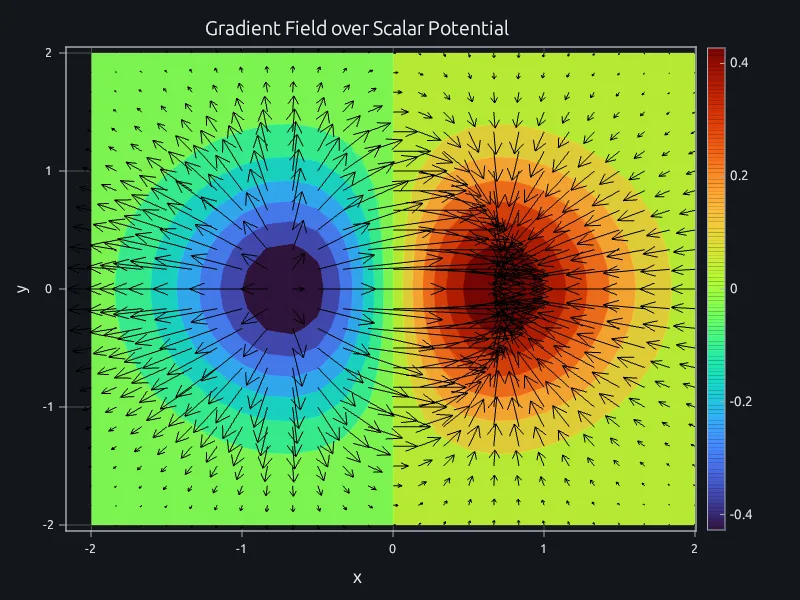
Gradient arrows over filled contours of a two-lobed potential, rendered by RunMat

Vector field

Gradient arrows over a filled-contour potential.
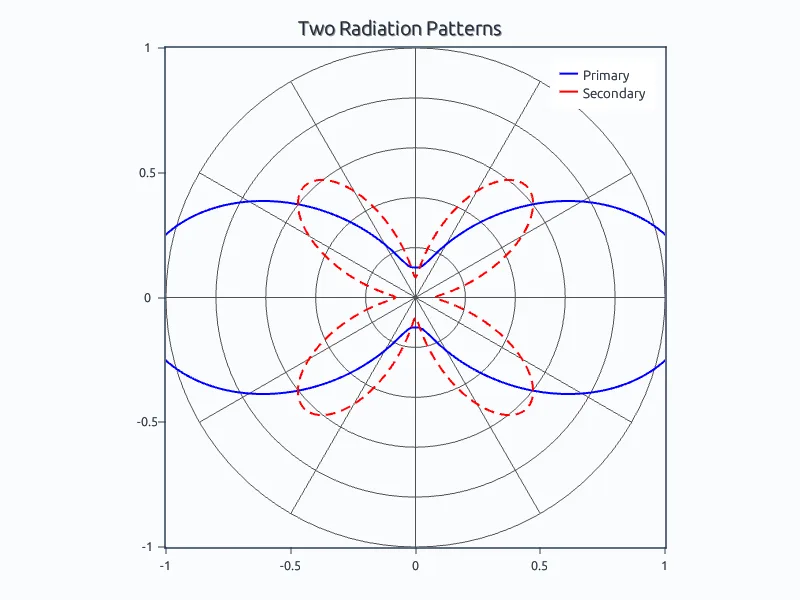
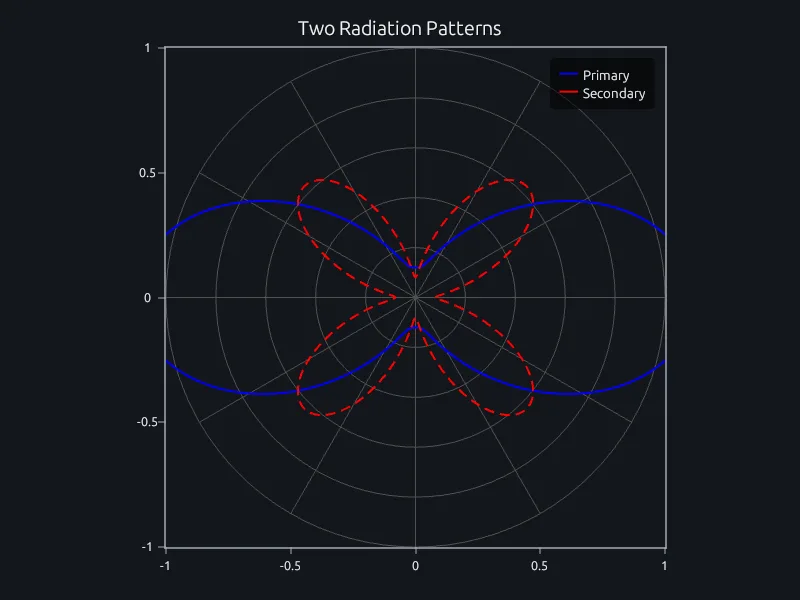
Two lobed patterns on polar axes, rendered by RunMat

Polar plot

Two radiation patterns on polar axes.
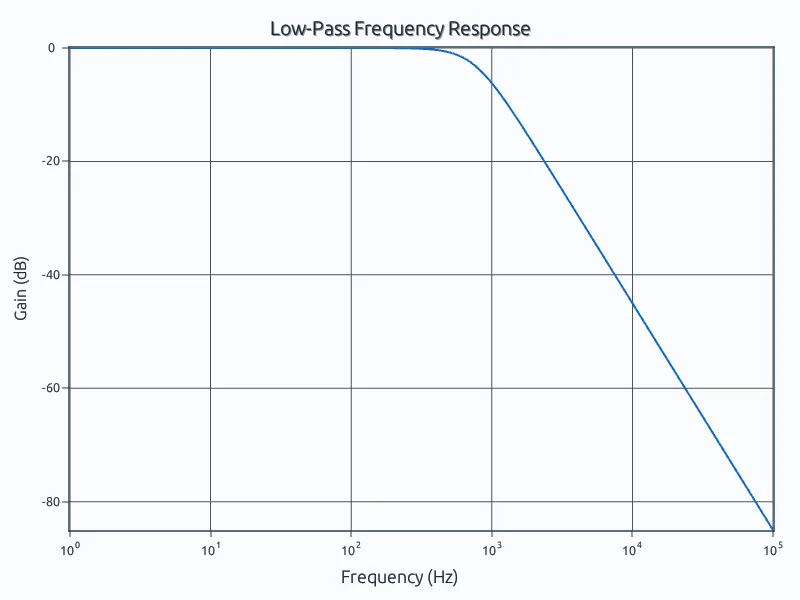
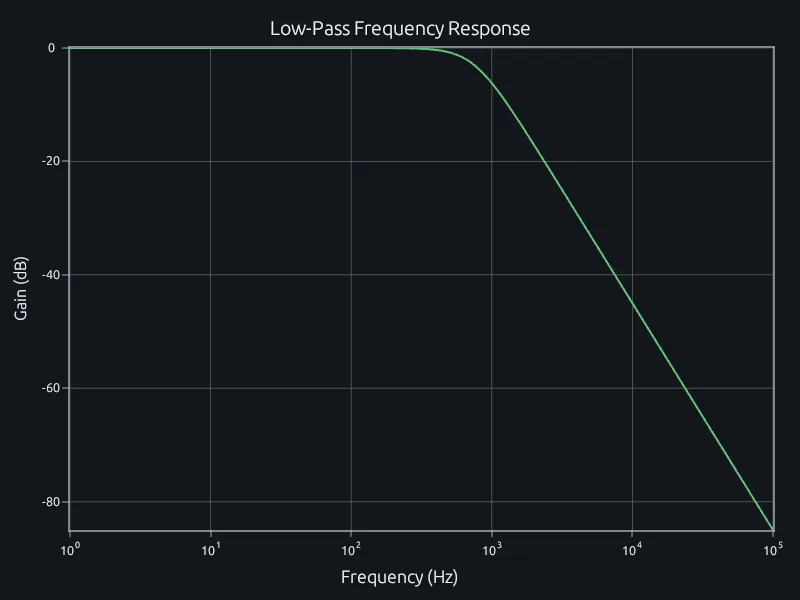
A low-pass gain curve against frequency on a log axis, rendered by RunMat

Log x-axis

A low-pass filter's frequency response.
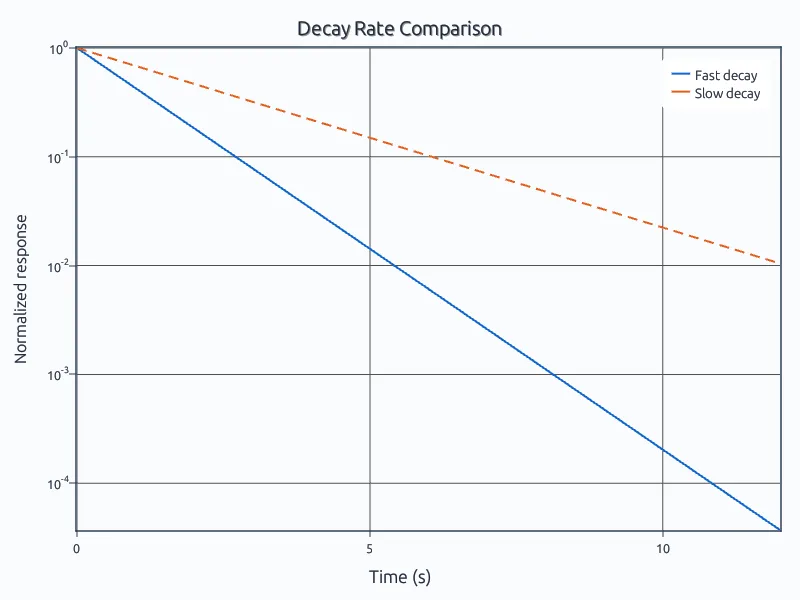
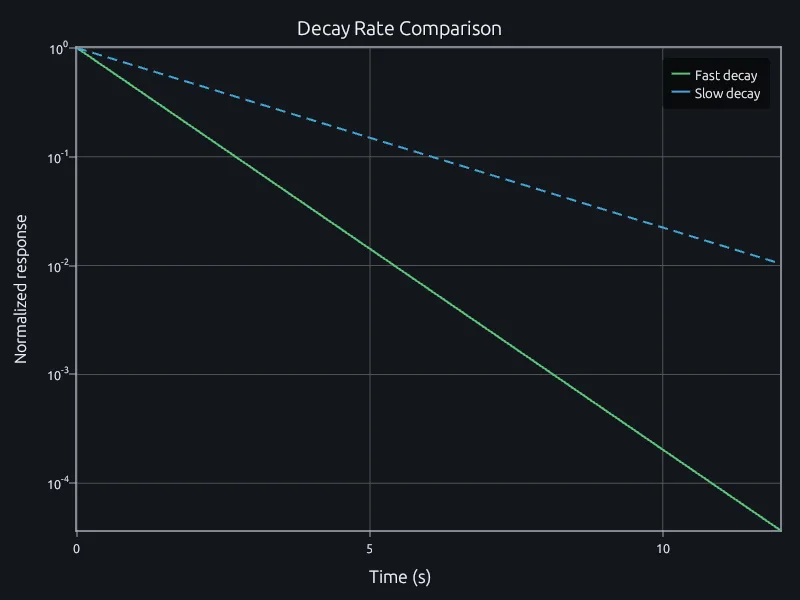
Two straight decay lines on a logarithmic y-axis, rendered by RunMat

Log y-axis

Two exponential decays on a log scale.
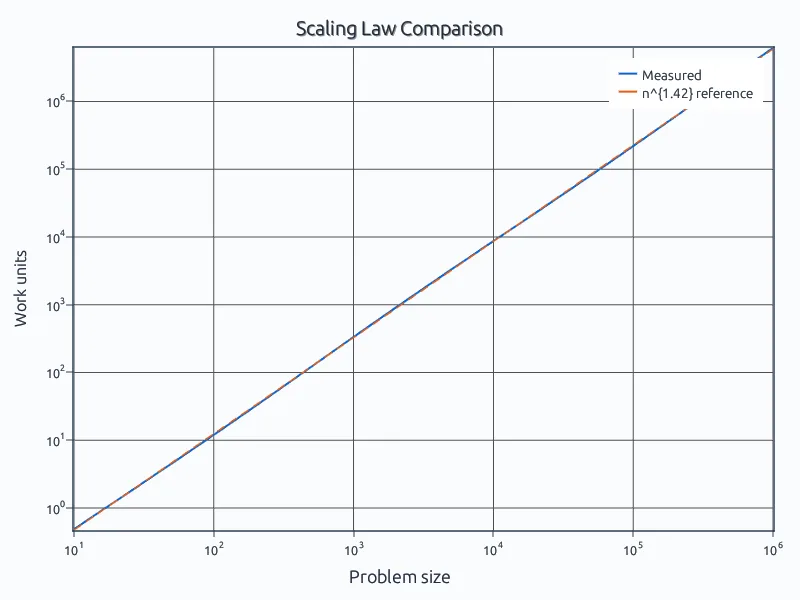
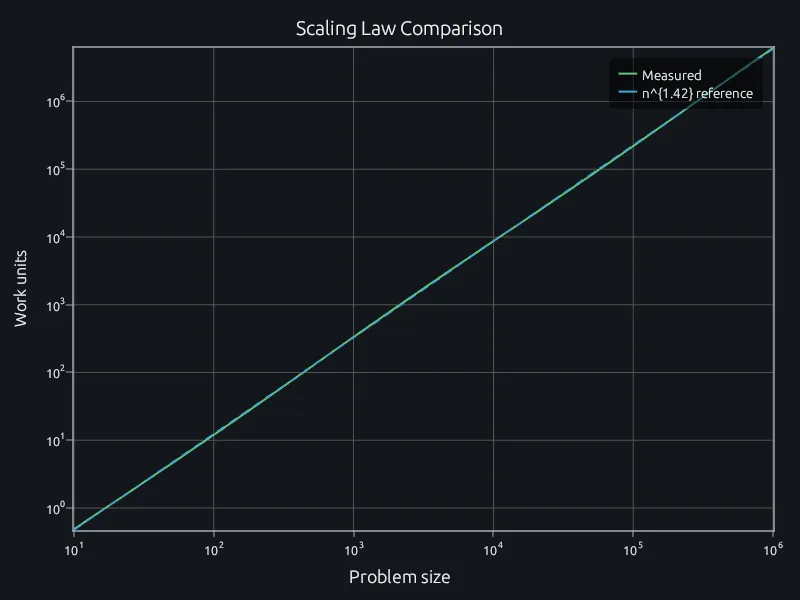
A power law drawn as a straight line on log-log axes, rendered by RunMat

Log-log plot

A power law and its reference line.

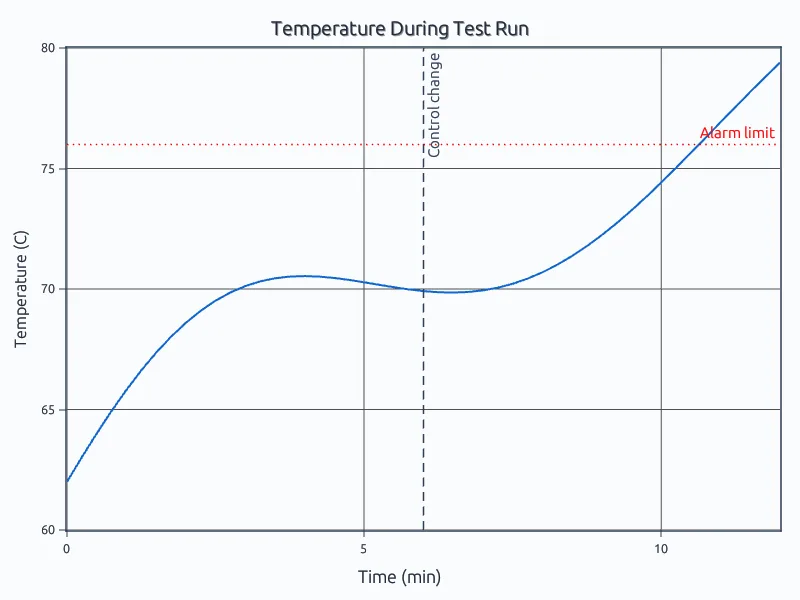
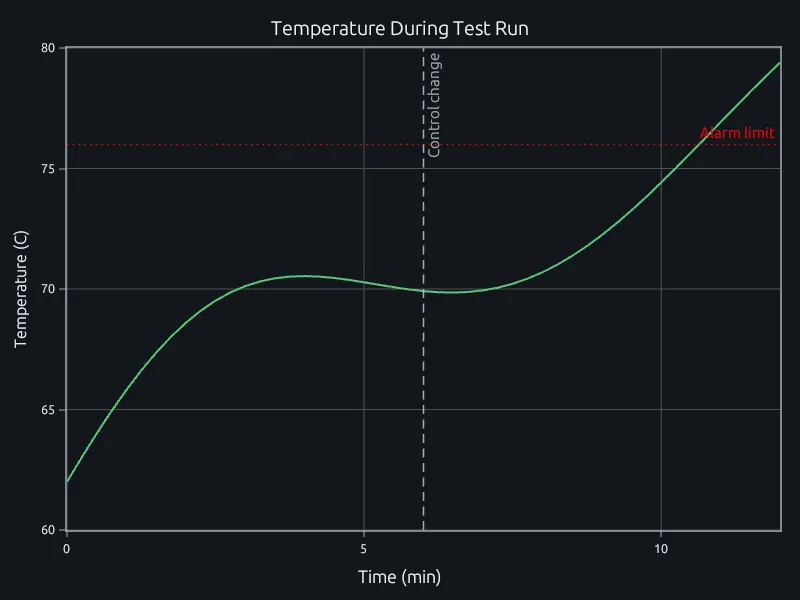
A temperature curve with a vertical marker and a horizontal limit line, rendered by RunMat

Reference lines

Mark a time and a limit with xline and yline.
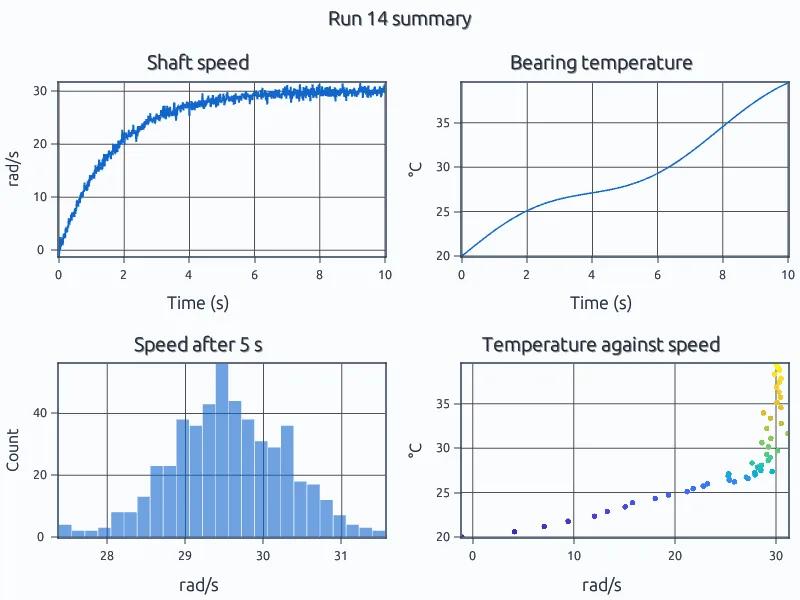
Compose a figure

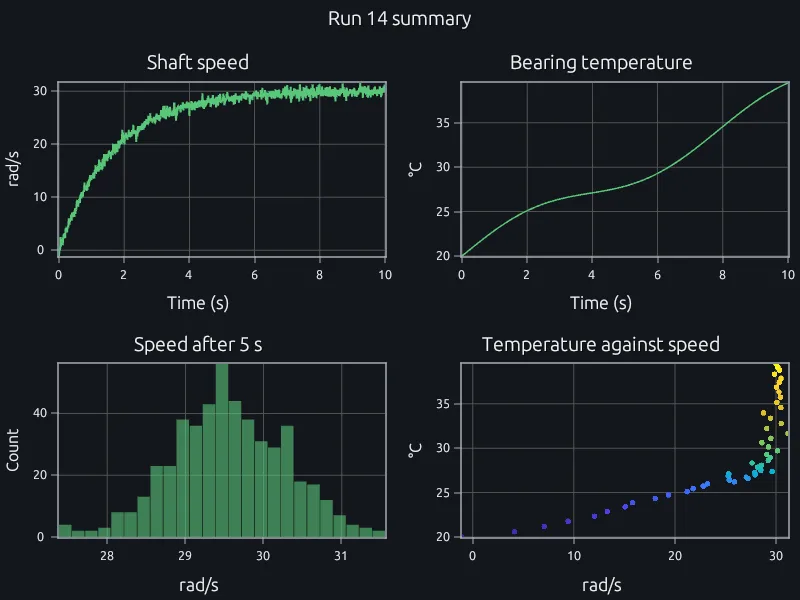
Four panels summarizing a test run under one title, rendered by RunMat

Four-panel figure

A test run summarized with subplot and sgtitle.
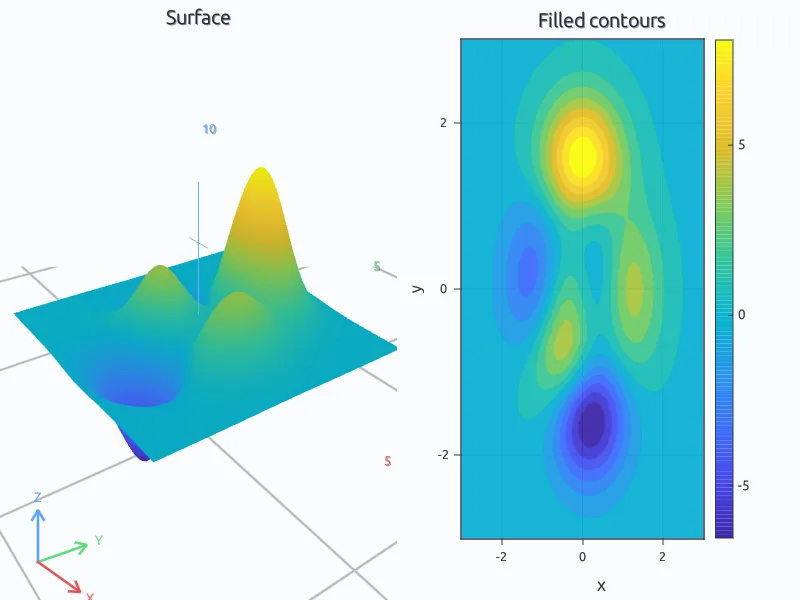
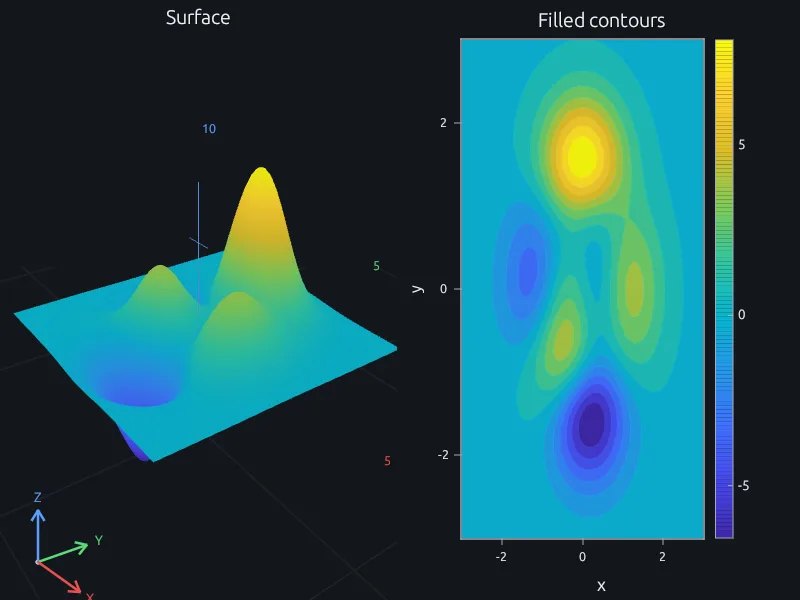
A surface on the left and its filled contours on the right, rendered by RunMat

Surface beside its contours

One field drawn two ways in one figure.
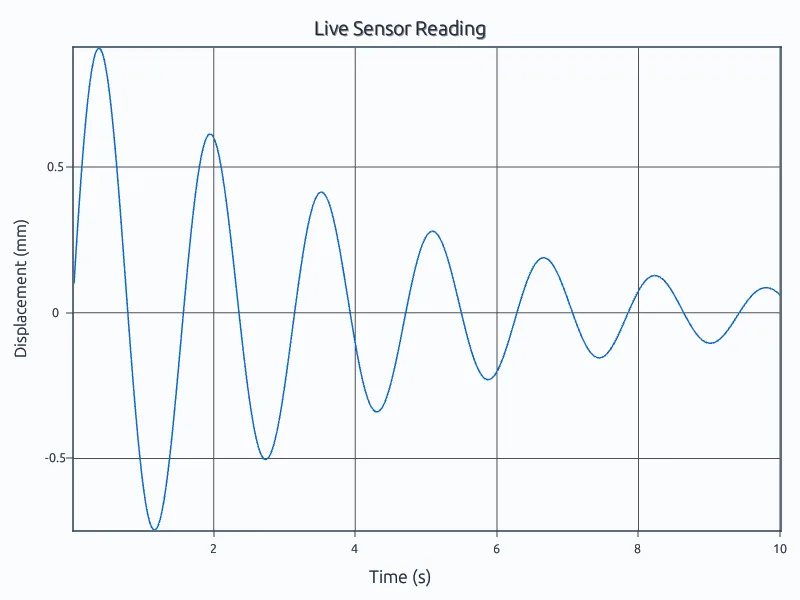
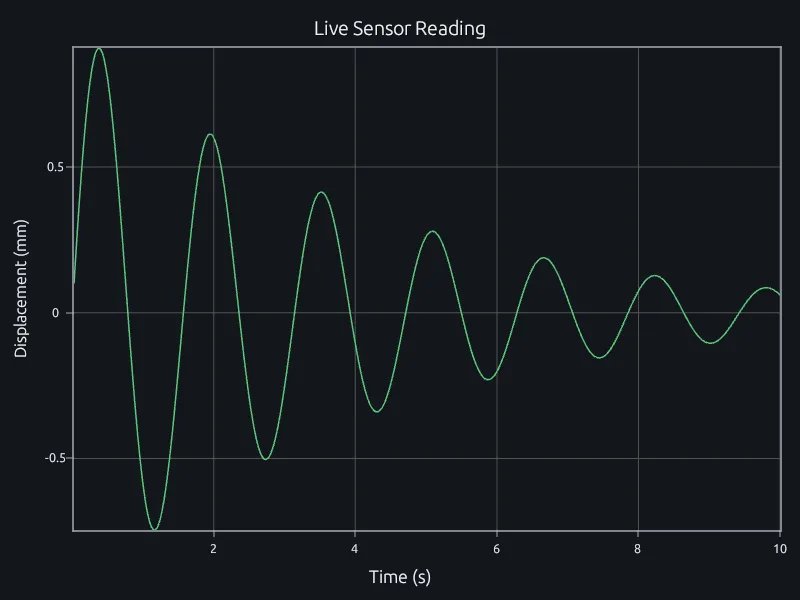
A decaying oscillation drawn point by point with animatedline, rendered by RunMat

Live-updating line

Points added to a line as they are computed.
Try it on your own data

Download RunMat
Read the docs